Danish vs Ugandan In Labor Force | Age 20-64

COMPARE

Danish
Race
Ancestry
AfghanAfricanAlaska NativeAlaskan AthabascanAlbanianAleutAlsatianAmericanApacheArabArapahoArgentineanArmenianAssyrian/Chaldean/SyriacAustralianAustrianBahamianBangladeshiBarbadianBasqueBelgianBelizeanBermudanBhutaneseBlackfeetBolivianBrazilianBritishBritish West IndianBulgarianBurmeseCajunCambodianCanadianCape VerdeanCarpatho RusynCelticCentral AmericanCentral American IndianCherokeeCheyenneChickasawChileanChineseChippewaChoctawColombianColvilleComancheCosta RicanCreeCreekCroatianCrowCubanCypriotCzechCzechoslovakianDanishDelawareDominicanDutchDutch West IndianEastern EuropeanEcuadorianEgyptianEnglishEstonianEthiopianEuropeanFijianFilipinoFinnishFrenchFrench American IndianFrench CanadianGermanGerman RussianGhanaianGreekGuamanian/ChamorroGuatemalanGuyaneseHaitianHmongHonduranHopiHoumaHungarianIcelanderIndian (Asian)IndonesianInupiatIranianIraqiIrishIroquoisIsraeliItalianJamaicanJapaneseJordanianKenyanKiowaKoreanLaotianLatvianLebaneseLiberianLithuanianLumbeeLuxembourgerMacedonianMalaysianMalteseMarshalleseMenomineeMexicanMexican American IndianMongolianMoroccanNative HawaiianNavajoNepaleseNew ZealanderNicaraguanNigerianNorthern EuropeanNorwegianOkinawanOsageOttawaPaiutePakistaniPalestinianPanamanianParaguayanPennsylvania GermanPeruvianPimaPolishPortuguesePotawatomiPuebloPuerto RicanPuget Sound SalishRomanianRussianSalvadoranSamoanScandinavianScotch-IrishScottishSeminoleSenegaleseSerbianShoshoneSierra LeoneanSiouxSlavicSlovakSloveneSomaliSouth AfricanSouth AmericanSouth American IndianSoviet UnionSpaniardSpanishSpanish AmericanSpanish American IndianSri LankanSubsaharan AfricanSudaneseSwedishSwissSyrianTaiwaneseThaiTlingit-HaidaTohono O'OdhamTonganTrinidadian and TobagonianTsimshianTurkishU.S. Virgin IslanderUkrainianUruguayanUteVenezuelanVietnameseWelshWest IndianYakamaYaquiYugoslavianYumanYup'ikZimbabwean
Immigration
NonimmigrantsImmigrantsAfghanistanAfricaAlbaniaArgentinaArmeniaAsiaAustraliaAustriaBahamasBangladeshBarbadosBelarusBelgiumBelizeBoliviaBosnia and HerzegovinaBrazilBulgariaBurma/MyanmarCabo VerdeCambodiaCameroonCanadaCaribbeanCentral AmericaChileChinaColombiaCongoCosta RicaCroatiaCubaCzechoslovakiaDenmarkDominicaDominican RepublicEastern AfricaEastern AsiaEastern EuropeEcuadorEgyptEl SalvadorEnglandEritreaEthiopiaEuropeFijiFranceGermanyGhanaGreeceGrenadaGuatemalaGuyanaHaitiHondurasHong KongHungaryIndiaIndonesiaIranIraqIrelandIsraelItalyJamaicaJapanJordanKazakhstanKenyaKoreaKuwaitLaosLatin AmericaLatviaLebanonLiberiaLithuaniaMalaysiaMexicoMicronesiaMiddle AfricaMoldovaMoroccoNepalNetherlandsNicaraguaNigeriaNorth AmericaNorth MacedoniaNorthern AfricaNorthern EuropeNorwayOceaniaPakistanPanamaPeruPhilippinesPolandPortugalRomaniaRussiaSaudi ArabiaScotlandSenegalSerbiaSierra LeoneSingaporeSomaliaSouth AfricaSouth AmericaSouth Central AsiaSouth Eastern AsiaSouthern EuropeSpainSri LankaSt. Vincent and the GrenadinesSudanSwedenSwitzerlandSyriaTaiwanThailandTrinidad and TobagoTurkeyUgandaUkraineUruguayUzbekistanVenezuelaVietnamWest IndiesWestern AfricaWestern AsiaWestern EuropeYemenZaireZimbabweAzores
Ugandan
Race
Ancestry
AfghanAfricanAlaska NativeAlaskan AthabascanAlbanianAleutAlsatianAmericanApacheArabArapahoArgentineanArmenianAssyrian/Chaldean/SyriacAustralianAustrianBahamianBangladeshiBarbadianBasqueBelgianBelizeanBermudanBhutaneseBlackfeetBolivianBrazilianBritishBritish West IndianBulgarianBurmeseCajunCambodianCanadianCape VerdeanCarpatho RusynCelticCentral AmericanCentral American IndianCherokeeCheyenneChickasawChileanChineseChippewaChoctawColombianColvilleComancheCosta RicanCreeCreekCroatianCrowCubanCypriotCzechCzechoslovakianDelawareDominicanDutchDutch West IndianEastern EuropeanEcuadorianEgyptianEnglishEstonianEthiopianEuropeanFijianFilipinoFinnishFrenchFrench American IndianFrench CanadianGermanGerman RussianGhanaianGreekGuamanian/ChamorroGuatemalanGuyaneseHaitianHmongHonduranHopiHoumaHungarianIcelanderIndian (Asian)IndonesianInupiatIranianIraqiIrishIroquoisIsraeliItalianJamaicanJapaneseJordanianKenyanKiowaKoreanLaotianLatvianLebaneseLiberianLithuanianLumbeeLuxembourgerMacedonianMalaysianMalteseMarshalleseMenomineeMexicanMexican American IndianMongolianMoroccanNative HawaiianNavajoNepaleseNew ZealanderNicaraguanNigerianNorthern EuropeanNorwegianOkinawanOsageOttawaPaiutePakistaniPalestinianPanamanianParaguayanPennsylvania GermanPeruvianPimaPolishPortuguesePotawatomiPuebloPuerto RicanPuget Sound SalishRomanianRussianSalvadoranSamoanScandinavianScotch-IrishScottishSeminoleSenegaleseSerbianShoshoneSierra LeoneanSiouxSlavicSlovakSloveneSomaliSouth AfricanSouth AmericanSouth American IndianSoviet UnionSpaniardSpanishSpanish AmericanSpanish American IndianSri LankanSubsaharan AfricanSudaneseSwedishSwissSyrianTaiwaneseThaiTlingit-HaidaTohono O'OdhamTonganTrinidadian and TobagonianTsimshianTurkishU.S. Virgin IslanderUgandanUkrainianUruguayanUteVenezuelanVietnameseWelshWest IndianYakamaYaquiYugoslavianYumanYup'ikZimbabwean
Immigration
NonimmigrantsImmigrantsAfghanistanAfricaAlbaniaArgentinaArmeniaAsiaAustraliaAustriaBahamasBangladeshBarbadosBelarusBelgiumBelizeBoliviaBosnia and HerzegovinaBrazilBulgariaBurma/MyanmarCabo VerdeCambodiaCameroonCanadaCaribbeanCentral AmericaChileChinaColombiaCongoCosta RicaCroatiaCubaCzechoslovakiaDenmarkDominicaDominican RepublicEastern AfricaEastern AsiaEastern EuropeEcuadorEgyptEl SalvadorEnglandEritreaEthiopiaEuropeFijiFranceGermanyGhanaGreeceGrenadaGuatemalaGuyanaHaitiHondurasHong KongHungaryIndiaIndonesiaIranIraqIrelandIsraelItalyJamaicaJapanJordanKazakhstanKenyaKoreaKuwaitLaosLatin AmericaLatviaLebanonLiberiaLithuaniaMalaysiaMexicoMicronesiaMiddle AfricaMoldovaMoroccoNepalNetherlandsNicaraguaNigeriaNorth AmericaNorth MacedoniaNorthern AfricaNorthern EuropeNorwayOceaniaPakistanPanamaPeruPhilippinesPolandPortugalRomaniaRussiaSaudi ArabiaScotlandSenegalSerbiaSierra LeoneSingaporeSomaliaSouth AfricaSouth AmericaSouth Central AsiaSouth Eastern AsiaSouthern EuropeSpainSri LankaSt. Vincent and the GrenadinesSudanSwedenSwitzerlandSyriaTaiwanThailandTrinidad and TobagoTurkeyUgandaUkraineUruguayUzbekistanVenezuelaVietnamWest IndiesWestern AfricaWestern AsiaWestern EuropeYemenZaireZimbabweAzores
In Labor Force | Age 20-64
Income
Poverty
Unemployment
Labor Participation
Family Structure
Vehicle Availability
Education Level
Disability

In Labor Force | Age 20-64 Comparison

Danes

Ugandans

Exceptional
Exceptional
79.9%
IN LABOR FORCE | AGE 20-64
91.5/ 100
METRIC RATING
125th/ 347
METRIC RANK
80.6%
IN LABOR FORCE | AGE 20-64
99.8/ 100
METRIC RATING
38th/ 347
METRIC RANK

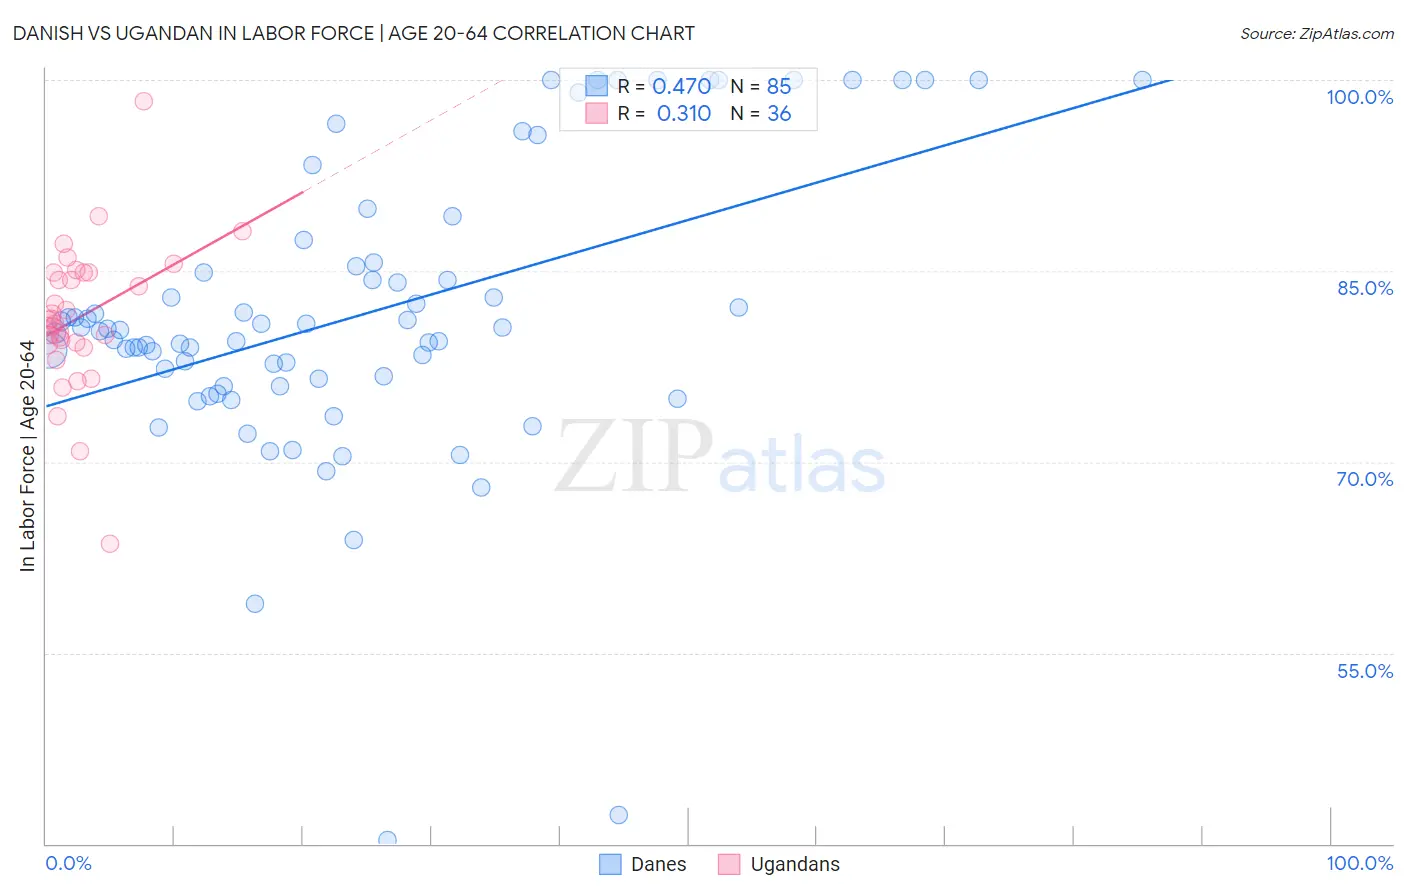
Danish vs Ugandan In Labor Force | Age 20-64 Correlation Chart

The statistical analysis conducted on geographies consisting of 474,188,887 people shows a moderate positive correlation between the proportion of Danes and labor force participation rate among population between the ages 20 and 64 in the United States with a correlation coefficient (R) of 0.470 and weighted average of 79.9%. Similarly, the statistical analysis conducted on geographies consisting of 94,018,069 people shows a mild positive correlation between the proportion of Ugandans and labor force participation rate among population between the ages 20 and 64 in the United States with a correlation coefficient (R) of 0.310 and weighted average of 80.6%, a difference of 0.77%.
Danish vs Ugandan In Labor Force | Age 20-64

In Labor Force | Age 20-64 Correlation Summary

MeasurementDanishUgandan
Minimum40.3%63.6%
Maximum100.0%98.3%
Range59.7%34.7%
Mean81.6%81.4%
Median80.4%81.0%
Interquartile 25% (IQ1)76.2%79.4%
Interquartile 75% (IQ3)85.5%84.9%
Interquartile Range (IQR)9.3%5.5%
Standard Deviation (Sample)11.5%5.7%
Standard Deviation (Population)11.4%5.7%

Similar Demographics by In Labor Force | Age 20-64

Demographics Similar to Danes by In Labor Force | Age 20-64

In terms of in labor force | age 20-64, the demographic groups most similar to Danes are Immigrants from Europe (79.9%, a difference of 0.0%), Mongolian (79.9%, a difference of 0.010%), Immigrants from Russia (79.9%, a difference of 0.010%), Immigrants from Kuwait (80.0%, a difference of 0.020%), and Immigrants from France (79.9%, a difference of 0.020%).
DemographicsRating | RankIn Labor Force | Age 20-64
Cape Verdeans
92.7
/100
|
#118
Exceptional
80.0%
Immigrants | Taiwan
92.5
/100
|
#119
Exceptional
80.0%
Maltese
92.4
/100
|
#120
Exceptional
80.0%
Immigrants | Kuwait
92.2
/100
|
#121
Exceptional
80.0%
Mongolians
92.0
/100
|
#122
Exceptional
79.9%
Immigrants | Russia
91.8
/100
|
#123
Exceptional
79.9%
Immigrants | Europe
91.6
/100
|
#124
Exceptional
79.9%
Danes
91.5
/100
|
#125
Exceptional
79.9%
Immigrants | France
90.7
/100
|
#126
Exceptional
79.9%
Immigrants | Czechoslovakia
89.7
/100
|
#127
Excellent
79.9%
Immigrants | Eastern Asia
89.4
/100
|
#128
Excellent
79.9%
Italians
88.9
/100
|
#129
Excellent
79.9%
Immigrants | Zaire
88.6
/100
|
#130
Excellent
79.9%
Immigrants | Iran
88.3
/100
|
#131
Excellent
79.9%
Indians (Asian)
87.7
/100
|
#132
Excellent
79.9%

Demographics Similar to Ugandans by In Labor Force | Age 20-64

In terms of in labor force | age 20-64, the demographic groups most similar to Ugandans are Brazilian (80.5%, a difference of 0.010%), Immigrants from Zimbabwe (80.5%, a difference of 0.010%), Paraguayan (80.6%, a difference of 0.020%), Immigrants from Moldova (80.6%, a difference of 0.020%), and Immigrants from Liberia (80.5%, a difference of 0.020%).
DemographicsRating | RankIn Labor Force | Age 20-64
Immigrants | Lithuania
99.9
/100
|
#31
Exceptional
80.7%
Immigrants | Ireland
99.9
/100
|
#32
Exceptional
80.7%
Chinese
99.9
/100
|
#33
Exceptional
80.7%
Immigrants | Brazil
99.9
/100
|
#34
Exceptional
80.7%
Immigrants | Poland
99.9
/100
|
#35
Exceptional
80.6%
Paraguayans
99.8
/100
|
#36
Exceptional
80.6%
Immigrants | Moldova
99.8
/100
|
#37
Exceptional
80.6%
Ugandans
99.8
/100
|
#38
Exceptional
80.6%
Brazilians
99.8
/100
|
#39
Exceptional
80.5%
Immigrants | Zimbabwe
99.8
/100
|
#40
Exceptional
80.5%
Immigrants | Liberia
99.8
/100
|
#41
Exceptional
80.5%
Latvians
99.8
/100
|
#42
Exceptional
80.5%
Czechs
99.7
/100
|
#43
Exceptional
80.5%
Immigrants | Middle Africa
99.7
/100
|
#44
Exceptional
80.5%
Slovenes
99.7
/100
|
#45
Exceptional
80.5%