Danish vs Native/Alaskan In Labor Force | Age 20-64
COMPARE
Danish
Native/Alaskan
In Labor Force | Age 20-64
In Labor Force | Age 20-64 Comparison
Danes
Natives/Alaskans
79.9%
IN LABOR FORCE | AGE 20-64
91.5/ 100
METRIC RATING
125th/ 347
METRIC RANK
73.9%
IN LABOR FORCE | AGE 20-64
0.0/ 100
METRIC RATING
333rd/ 347
METRIC RANK
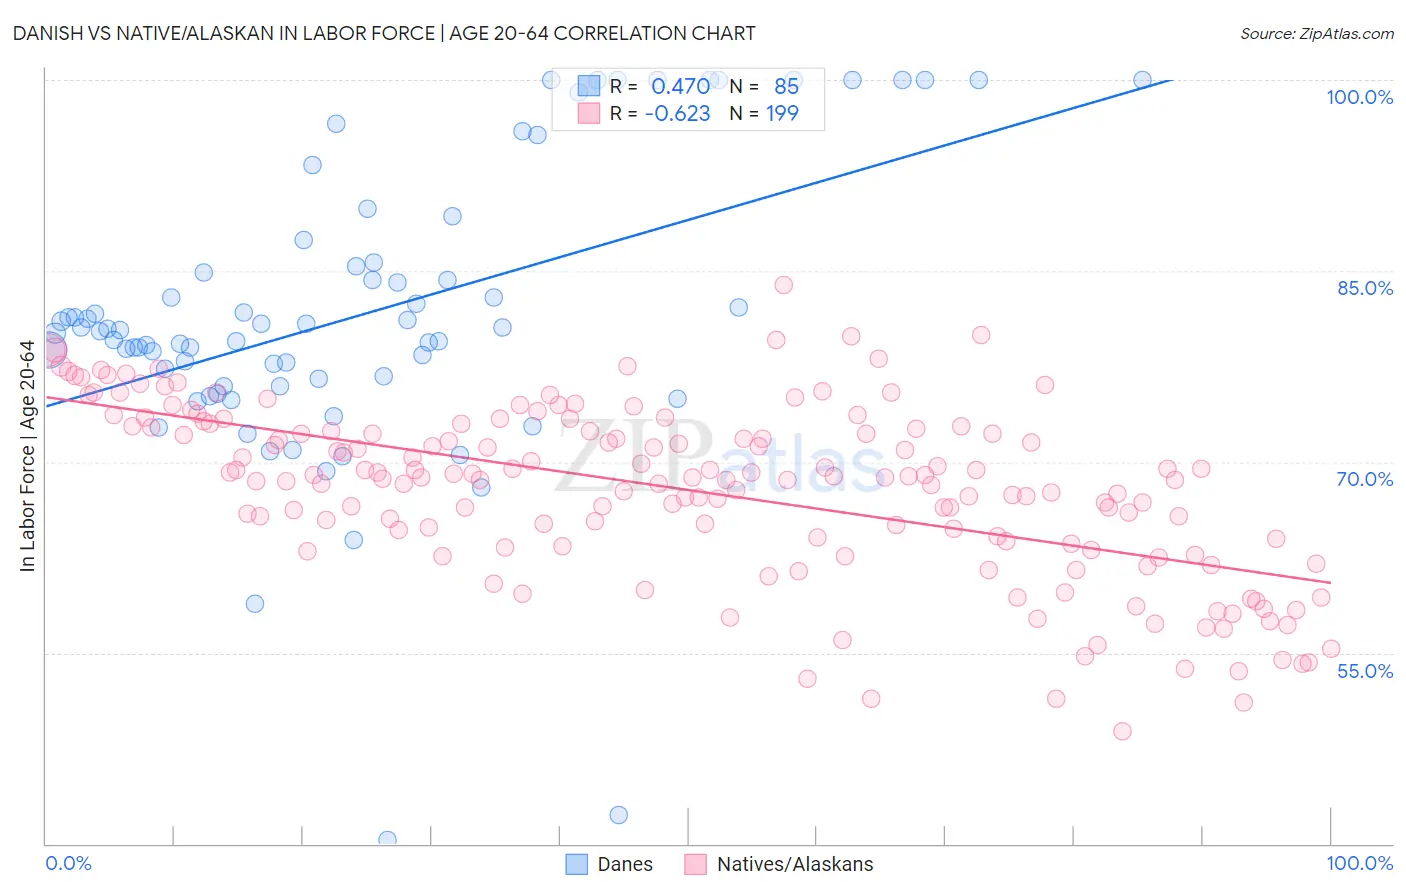
Danish vs Native/Alaskan In Labor Force | Age 20-64 Correlation Chart
The statistical analysis conducted on geographies consisting of 474,188,887 people shows a moderate positive correlation between the proportion of Danes and labor force participation rate among population between the ages 20 and 64 in the United States with a correlation coefficient (R) of 0.470 and weighted average of 79.9%. Similarly, the statistical analysis conducted on geographies consisting of 513,028,645 people shows a significant negative correlation between the proportion of Natives/Alaskans and labor force participation rate among population between the ages 20 and 64 in the United States with a correlation coefficient (R) of -0.623 and weighted average of 73.9%, a difference of 8.2%.
In Labor Force | Age 20-64 Correlation Summary
| Measurement | Danish | Native/Alaskan |
| Minimum | 40.3% | 48.8% |
| Maximum | 100.0% | 83.9% |
| Range | 59.7% | 35.1% |
| Mean | 81.6% | 67.8% |
| Median | 80.4% | 68.8% |
| Interquartile 25% (IQ1) | 76.2% | 63.6% |
| Interquartile 75% (IQ3) | 85.5% | 72.7% |
| Interquartile Range (IQR) | 9.3% | 9.2% |
| Standard Deviation (Sample) | 11.5% | 6.8% |
| Standard Deviation (Population) | 11.4% | 6.8% |
Similar Demographics by In Labor Force | Age 20-64
Demographics Similar to Danes by In Labor Force | Age 20-64
In terms of in labor force | age 20-64, the demographic groups most similar to Danes are Immigrants from Europe (79.9%, a difference of 0.0%), Mongolian (79.9%, a difference of 0.010%), Immigrants from Russia (79.9%, a difference of 0.010%), Immigrants from Kuwait (80.0%, a difference of 0.020%), and Immigrants from France (79.9%, a difference of 0.020%).
| Demographics | Rating | Rank | In Labor Force | Age 20-64 |
| Cape Verdeans | 92.7 /100 | #118 | Exceptional 80.0% |
| Immigrants | Taiwan | 92.5 /100 | #119 | Exceptional 80.0% |
| Maltese | 92.4 /100 | #120 | Exceptional 80.0% |
| Immigrants | Kuwait | 92.2 /100 | #121 | Exceptional 80.0% |
| Mongolians | 92.0 /100 | #122 | Exceptional 79.9% |
| Immigrants | Russia | 91.8 /100 | #123 | Exceptional 79.9% |
| Immigrants | Europe | 91.6 /100 | #124 | Exceptional 79.9% |
| Danes | 91.5 /100 | #125 | Exceptional 79.9% |
| Immigrants | France | 90.7 /100 | #126 | Exceptional 79.9% |
| Immigrants | Czechoslovakia | 89.7 /100 | #127 | Excellent 79.9% |
| Immigrants | Eastern Asia | 89.4 /100 | #128 | Excellent 79.9% |
| Italians | 88.9 /100 | #129 | Excellent 79.9% |
| Immigrants | Zaire | 88.6 /100 | #130 | Excellent 79.9% |
| Immigrants | Iran | 88.3 /100 | #131 | Excellent 79.9% |
| Indians (Asian) | 87.7 /100 | #132 | Excellent 79.9% |
Demographics Similar to Natives/Alaskans by In Labor Force | Age 20-64
In terms of in labor force | age 20-64, the demographic groups most similar to Natives/Alaskans are Apache (73.7%, a difference of 0.30%), Ute (73.7%, a difference of 0.32%), Arapaho (74.4%, a difference of 0.66%), Crow (73.3%, a difference of 0.83%), and Yup'ik (73.2%, a difference of 0.95%).
| Demographics | Rating | Rank | In Labor Force | Age 20-64 |
| Creek | 0.0 /100 | #326 | Tragic 75.1% |
| Sioux | 0.0 /100 | #327 | Tragic 75.0% |
| Kiowa | 0.0 /100 | #328 | Tragic 75.0% |
| Cheyenne | 0.0 /100 | #329 | Tragic 74.8% |
| Colville | 0.0 /100 | #330 | Tragic 74.8% |
| Paiute | 0.0 /100 | #331 | Tragic 74.7% |
| Arapaho | 0.0 /100 | #332 | Tragic 74.4% |
| Natives/Alaskans | 0.0 /100 | #333 | Tragic 73.9% |
| Apache | 0.0 /100 | #334 | Tragic 73.7% |
| Ute | 0.0 /100 | #335 | Tragic 73.7% |
| Crow | 0.0 /100 | #336 | Tragic 73.3% |
| Yup'ik | 0.0 /100 | #337 | Tragic 73.2% |
| Puerto Ricans | 0.0 /100 | #338 | Tragic 73.1% |
| Houma | 0.0 /100 | #339 | Tragic 72.7% |
| Pueblo | 0.0 /100 | #340 | Tragic 72.6% |