Zip Codes with the Highest Percentage of Population Employed in Food Preparation & Serving in Lake Charles, LA
RELATED REPORTS & OPTIONS
Food Preparation & Serving
Lake Charles
Compare Zip Codes
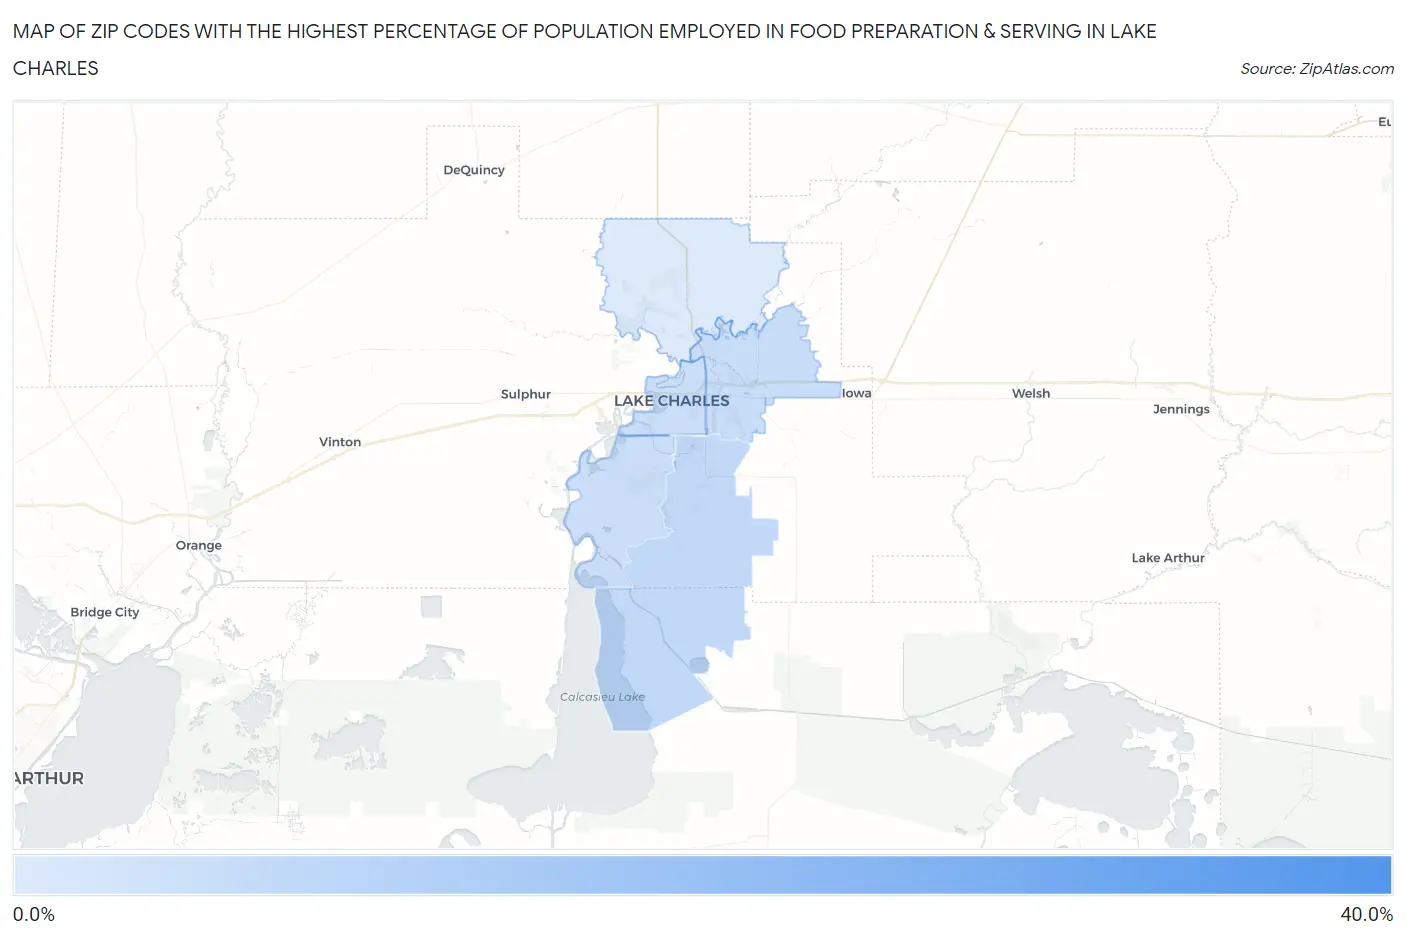
Map of Zip Codes with the Highest Percentage of Population Employed in Food Preparation & Serving in Lake Charles
0.0%
40.0%
Zip Codes with the Highest Percentage of Population Employed in Food Preparation & Serving in Lake Charles, LA
| Zip Code | % Employed | vs State | vs National | |
| 1. | 70609 | 32.1% | 6.0%(+26.1)#6 | 5.3%(+26.8)#183 |
| 2. | 70607 | 8.4% | 6.0%(+2.34)#90 | 5.3%(+3.10)#4,197 |
| 3. | 70615 | 7.1% | 6.0%(+1.09)#124 | 5.3%(+1.85)#6,272 |
| 4. | 70605 | 6.7% | 6.0%(+0.676)#140 | 5.3%(+1.43)#7,295 |
| 5. | 70601 | 6.6% | 6.0%(+0.514)#147 | 5.3%(+1.27)#7,713 |
| 6. | 70611 | 3.6% | 6.0%(-2.45)#297 | 5.3%(-1.69)#18,804 |
1
Common Questions
What are the Top 5 Zip Codes with the Highest Percentage of Population Employed in Food Preparation & Serving in Lake Charles, LA?
Top 5 Zip Codes with the Highest Percentage of Population Employed in Food Preparation & Serving in Lake Charles, LA are:
What zip code has the Highest Percentage of Population Employed in Food Preparation & Serving in Lake Charles, LA?
70609 has the Highest Percentage of Population Employed in Food Preparation & Serving in Lake Charles, LA with 32.1%.
What is the Percentage of Population Employed in Food Preparation & Serving in Lake Charles, LA?
Percentage of Population Employed in Food Preparation & Serving in Lake Charles is 7.4%.
What is the Percentage of Population Employed in Food Preparation & Serving in Louisiana?
Percentage of Population Employed in Food Preparation & Serving in Louisiana is 6.0%.
What is the Percentage of Population Employed in Food Preparation & Serving in the United States?
Percentage of Population Employed in Food Preparation & Serving in the United States is 5.3%.