Zip Codes with the Highest Percentage of Population Employed in Food Preparation & Serving in Houma, LA
RELATED REPORTS & OPTIONS
Food Preparation & Serving
Houma
Compare Zip Codes
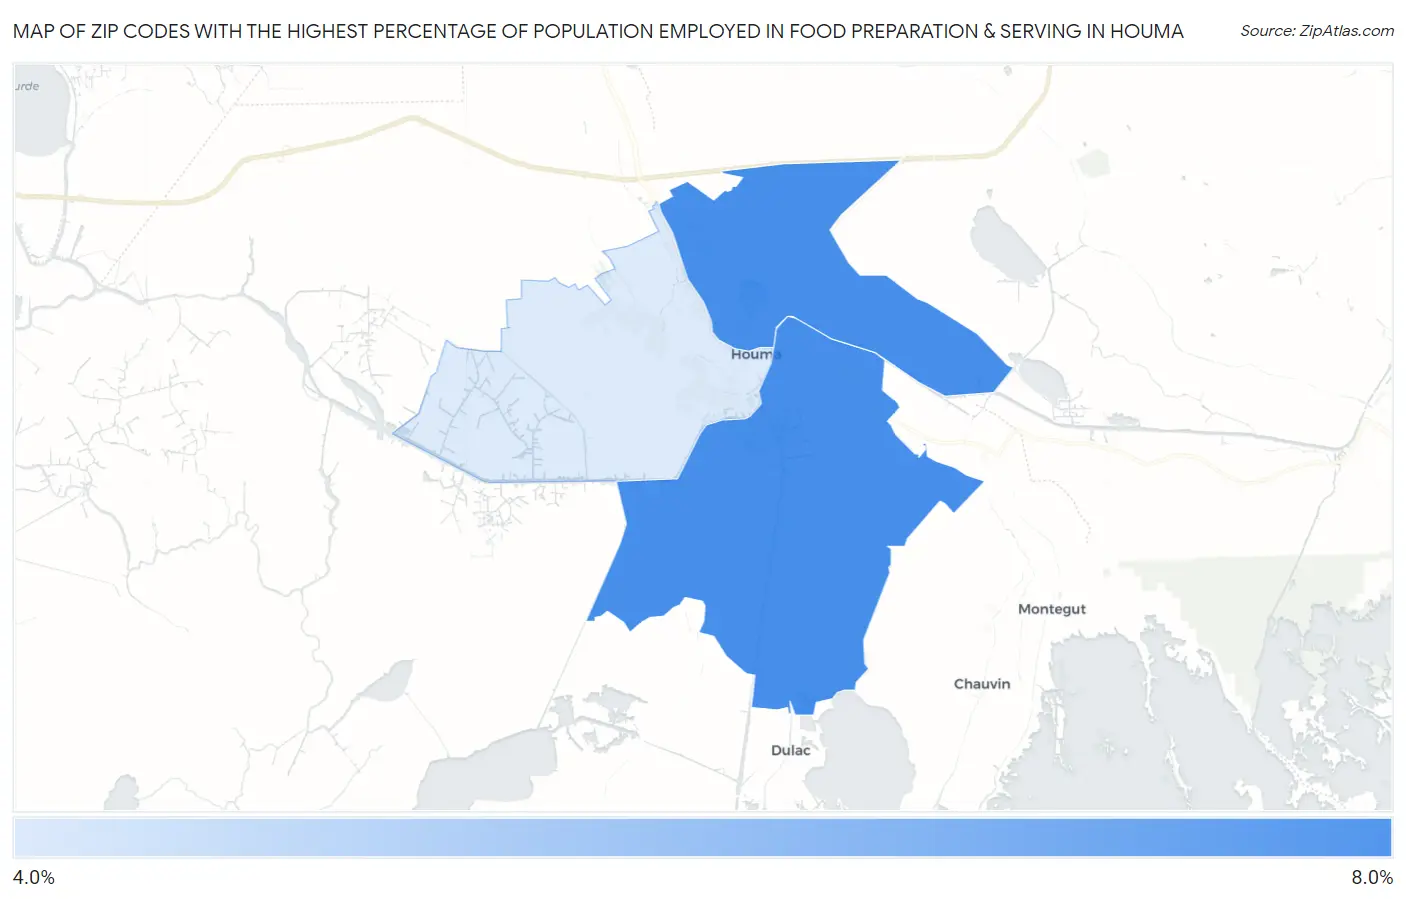
Map of Zip Codes with the Highest Percentage of Population Employed in Food Preparation & Serving in Houma
0.0%
8.0%
Zip Codes with the Highest Percentage of Population Employed in Food Preparation & Serving in Houma, LA
| Zip Code | % Employed | vs State | vs National | |
| 1. | 70364 | 7.3% | 6.0%(+1.30)#117 | 5.3%(+2.05)#5,861 |
| 2. | 70363 | 7.3% | 6.0%(+1.28)#118 | 5.3%(+2.03)#5,889 |
| 3. | 70360 | 4.4% | 6.0%(-1.69)#251 | 5.3%(-0.934)#15,633 |
1
Common Questions
What are the Top Zip Codes with the Highest Percentage of Population Employed in Food Preparation & Serving in Houma, LA?
Top Zip Codes with the Highest Percentage of Population Employed in Food Preparation & Serving in Houma, LA are:
What zip code has the Highest Percentage of Population Employed in Food Preparation & Serving in Houma, LA?
70364 has the Highest Percentage of Population Employed in Food Preparation & Serving in Houma, LA with 7.3%.
What is the Percentage of Population Employed in Food Preparation & Serving in Houma, LA?
Percentage of Population Employed in Food Preparation & Serving in Houma is 6.2%.
What is the Percentage of Population Employed in Food Preparation & Serving in Louisiana?
Percentage of Population Employed in Food Preparation & Serving in Louisiana is 6.0%.
What is the Percentage of Population Employed in Food Preparation & Serving in the United States?
Percentage of Population Employed in Food Preparation & Serving in the United States is 5.3%.