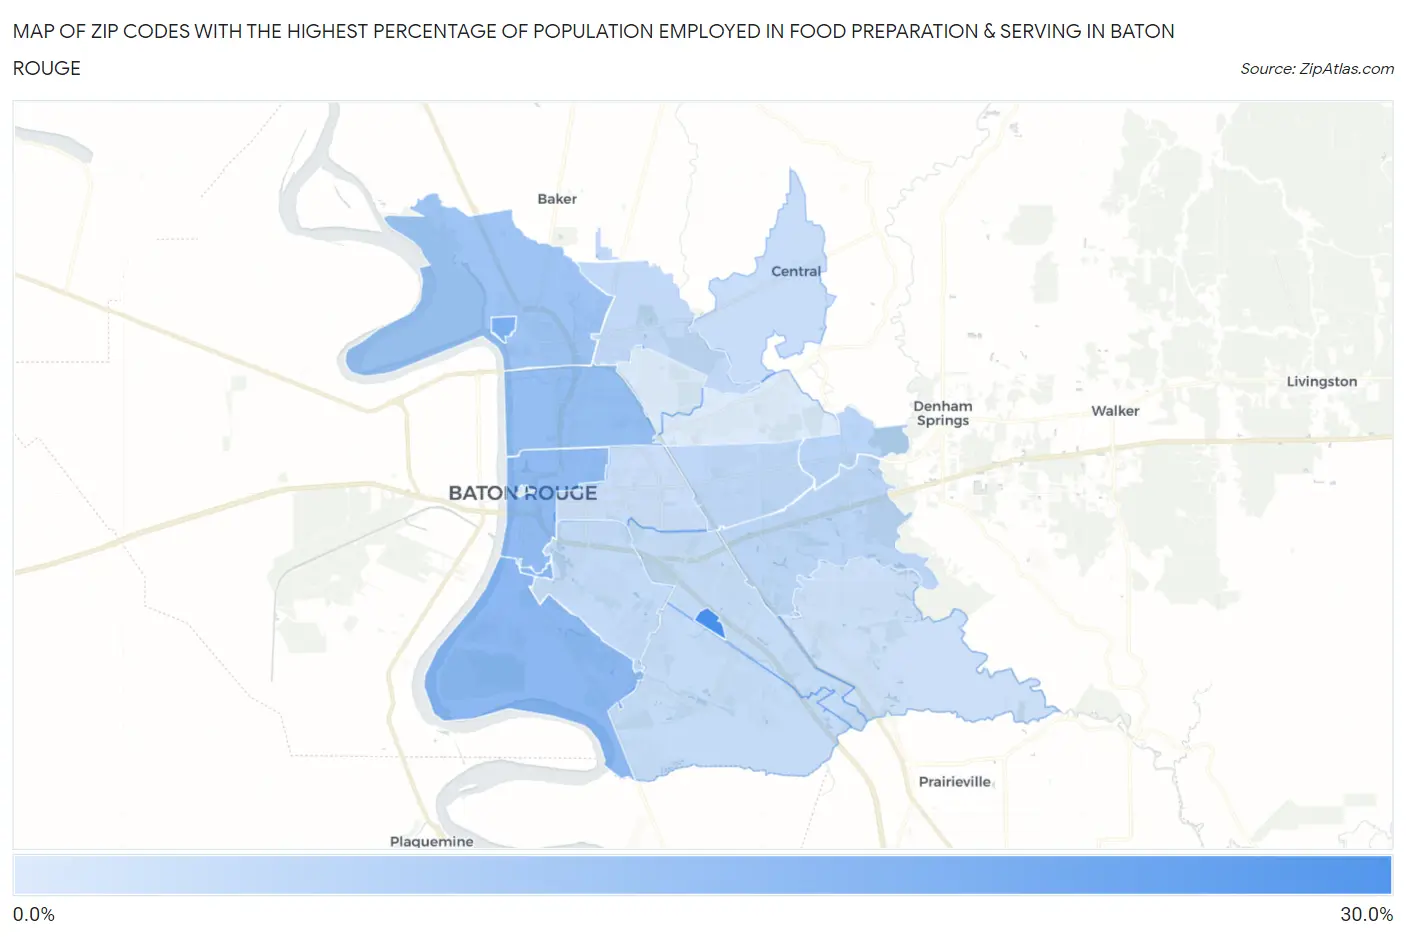
Zip Codes with the Highest Percentage of Population Employed in Food Preparation & Serving in Baton Rouge, LA
RELATED REPORTS & OPTIONS
Food Preparation & Serving
Baton Rouge
Compare Zip Codes
Map of Zip Codes with the Highest Percentage of Population Employed in Food Preparation & Serving in Baton Rouge
0.0%
30.0%
Zip Codes with the Highest Percentage of Population Employed in Food Preparation & Serving in Baton Rouge, LA
| Zip Code | % Employed | vs State | vs National | |
| 1. | 70836 | 25.3% | 6.0%(+19.3)#9 | 5.3%(+20.1)#303 |
| 2. | 70813 | 16.8% | 6.0%(+10.8)#20 | 5.3%(+11.5)#764 |
| 3. | 70803 | 14.3% | 6.0%(+8.23)#33 | 5.3%(+8.99)#1,108 |
| 4. | 70820 | 13.8% | 6.0%(+7.72)#35 | 5.3%(+8.48)#1,219 |
| 5. | 70802 | 13.0% | 6.0%(+6.96)#39 | 5.3%(+7.71)#1,397 |
| 6. | 70805 | 12.3% | 6.0%(+6.22)#44 | 5.3%(+6.97)#1,579 |
| 7. | 70807 | 10.9% | 6.0%(+4.83)#54 | 5.3%(+5.59)#2,121 |
| 8. | 70819 | 6.8% | 6.0%(+0.773)#135 | 5.3%(+1.53)#7,034 |
| 9. | 70816 | 6.6% | 6.0%(+0.525)#146 | 5.3%(+1.28)#7,682 |
| 10. | 70815 | 6.1% | 6.0%(+0.040)#167 | 5.3%(+0.795)#9,079 |
| 11. | 70811 | 5.7% | 6.0%(-0.380)#179 | 5.3%(+0.375)#10,481 |
| 12. | 70808 | 5.4% | 6.0%(-0.671)#195 | 5.3%(+0.085)#11,504 |
| 13. | 70809 | 5.2% | 6.0%(-0.813)#204 | 5.3%(-0.057)#12,026 |
| 14. | 70810 | 5.1% | 6.0%(-0.983)#214 | 5.3%(-0.228)#12,701 |
| 15. | 70818 | 4.7% | 6.0%(-1.32)#236 | 5.3%(-0.565)#14,079 |
| 16. | 70806 | 4.5% | 6.0%(-1.52)#241 | 5.3%(-0.766)#14,937 |
| 17. | 70817 | 4.1% | 6.0%(-1.93)#274 | 5.3%(-1.17)#16,656 |
| 18. | 70812 | 1.9% | 6.0%(-4.14)#384 | 5.3%(-3.38)#24,992 |
| 19. | 70814 | 1.8% | 6.0%(-4.26)#388 | 5.3%(-3.50)#25,306 |
1
Common Questions
What are the Top 10 Zip Codes with the Highest Percentage of Population Employed in Food Preparation & Serving in Baton Rouge, LA?
Top 10 Zip Codes with the Highest Percentage of Population Employed in Food Preparation & Serving in Baton Rouge, LA are:
What zip code has the Highest Percentage of Population Employed in Food Preparation & Serving in Baton Rouge, LA?
70836 has the Highest Percentage of Population Employed in Food Preparation & Serving in Baton Rouge, LA with 25.3%.
What is the Percentage of Population Employed in Food Preparation & Serving in Baton Rouge, LA?
Percentage of Population Employed in Food Preparation & Serving in Baton Rouge is 7.8%.
What is the Percentage of Population Employed in Food Preparation & Serving in Louisiana?
Percentage of Population Employed in Food Preparation & Serving in Louisiana is 6.0%.
What is the Percentage of Population Employed in Food Preparation & Serving in the United States?
Percentage of Population Employed in Food Preparation & Serving in the United States is 5.3%.