Zip Codes with the Highest Percentage of Population Employed in Food Preparation & Serving in Lafayette, LA
RELATED REPORTS & OPTIONS
Food Preparation & Serving
Lafayette
Compare Zip Codes
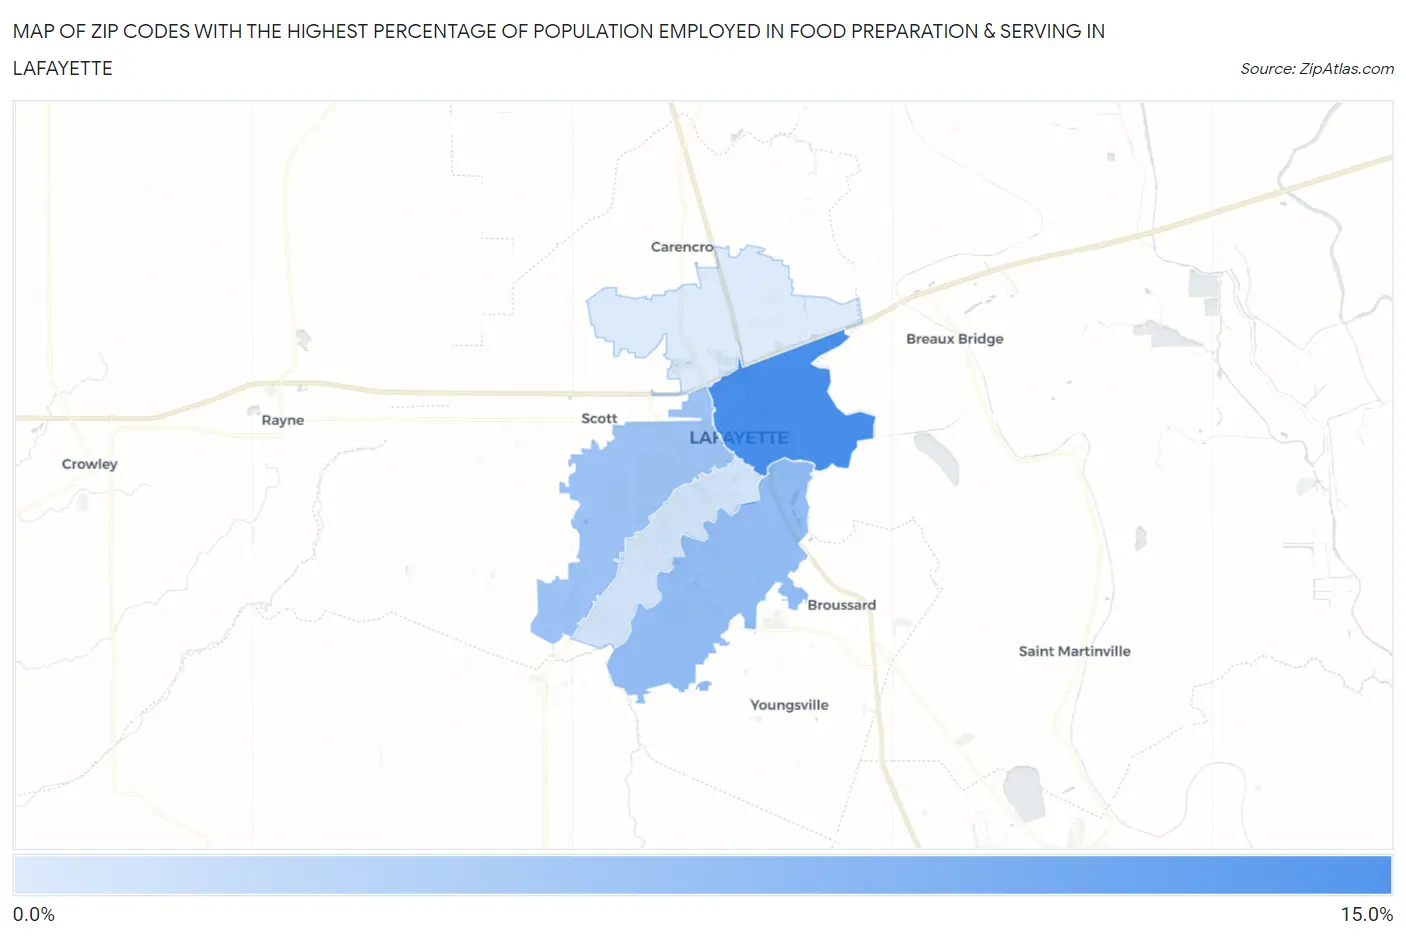
Map of Zip Codes with the Highest Percentage of Population Employed in Food Preparation & Serving in Lafayette
0.0%
15.0%
Zip Codes with the Highest Percentage of Population Employed in Food Preparation & Serving in Lafayette, LA
| Zip Code | % Employed | vs State | vs National | |
| 1. | 70501 | 12.3% | 6.0%(+6.22)#45 | 5.3%(+6.97)#1,580 |
| 2. | 70508 | 8.0% | 6.0%(+1.93)#105 | 5.3%(+2.68)#4,770 |
| 3. | 70506 | 7.3% | 6.0%(+1.25)#119 | 5.3%(+2.00)#5,949 |
| 4. | 70503 | 4.4% | 6.0%(-1.61)#246 | 5.3%(-0.858)#15,302 |
| 5. | 70507 | 3.7% | 6.0%(-2.30)#288 | 5.3%(-1.55)#18,172 |
1
Common Questions
What are the Top 3 Zip Codes with the Highest Percentage of Population Employed in Food Preparation & Serving in Lafayette, LA?
Top 3 Zip Codes with the Highest Percentage of Population Employed in Food Preparation & Serving in Lafayette, LA are:
What zip code has the Highest Percentage of Population Employed in Food Preparation & Serving in Lafayette, LA?
70501 has the Highest Percentage of Population Employed in Food Preparation & Serving in Lafayette, LA with 12.3%.
What is the Percentage of Population Employed in Food Preparation & Serving in Lafayette, LA?
Percentage of Population Employed in Food Preparation & Serving in Lafayette is 8.1%.
What is the Percentage of Population Employed in Food Preparation & Serving in Louisiana?
Percentage of Population Employed in Food Preparation & Serving in Louisiana is 6.0%.
What is the Percentage of Population Employed in Food Preparation & Serving in the United States?
Percentage of Population Employed in Food Preparation & Serving in the United States is 5.3%.