Zip Codes with the Highest Percentage of Population Employed in Community & Social Service in Topeka, KS
RELATED REPORTS & OPTIONS
Community & Social Service
Topeka
Compare Zip Codes
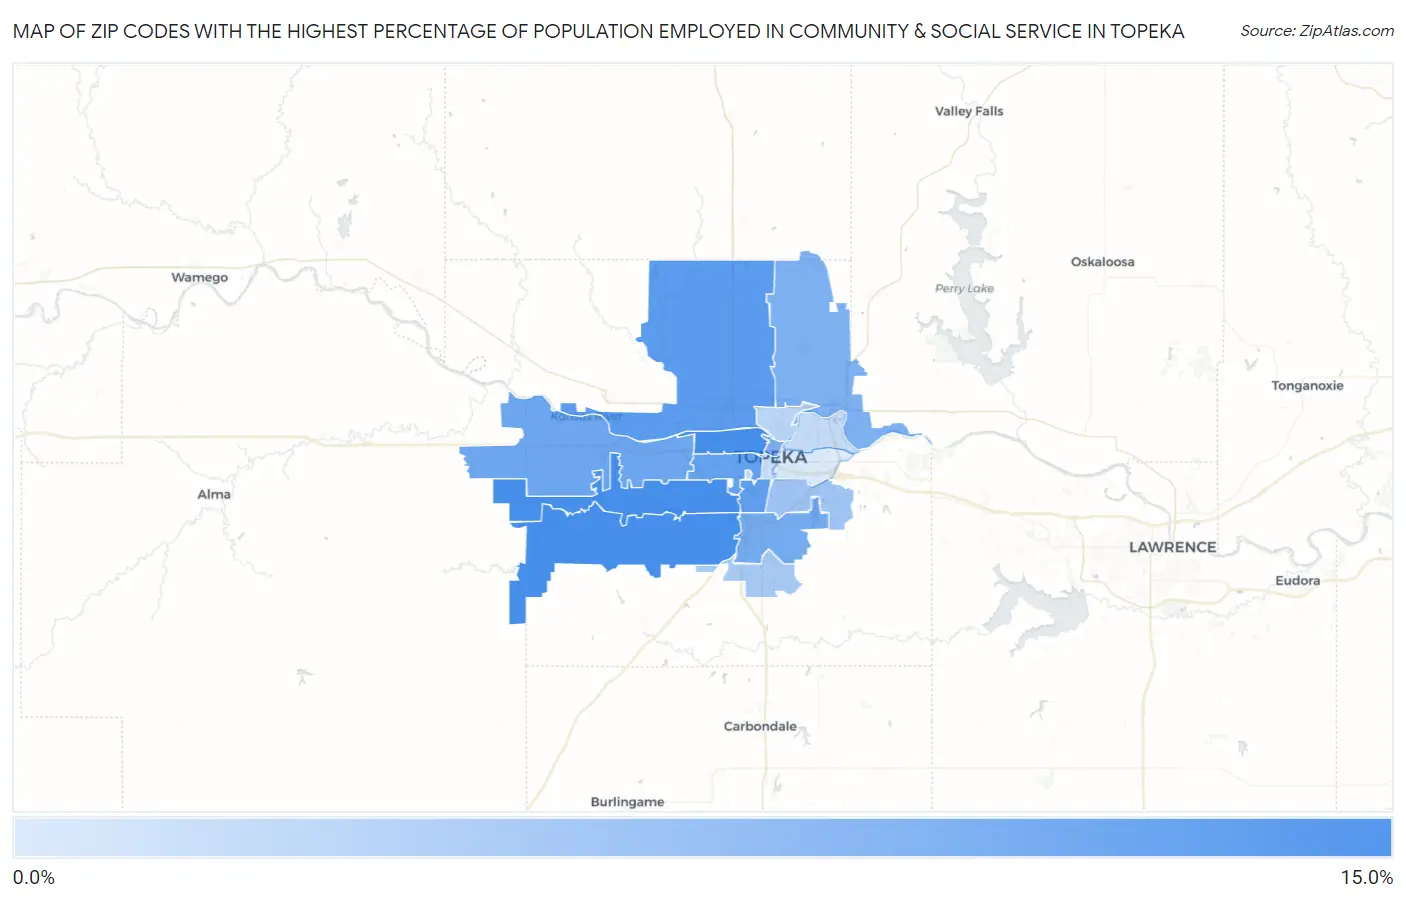
Map of Zip Codes with the Highest Percentage of Population Employed in Community & Social Service in Topeka
0.0%
15.0%
Zip Codes with the Highest Percentage of Population Employed in Community & Social Service in Topeka, KS
| Zip Code | % Employed | vs State | vs National | |
| 1. | 66610 | 13.7% | 11.3%(+2.42)#140 | 11.2%(+2.49)#6,464 |
| 2. | 66606 | 13.7% | 11.3%(+2.37)#141 | 11.2%(+2.44)#6,536 |
| 3. | 66614 | 13.7% | 11.3%(+2.37)#142 | 11.2%(+2.44)#6,541 |
| 4. | 66618 | 12.5% | 11.3%(+1.21)#184 | 11.2%(+1.28)#8,441 |
| 5. | 66611 | 12.0% | 11.3%(+0.676)#203 | 11.2%(+0.747)#9,457 |
| 6. | 66604 | 11.8% | 11.3%(+0.483)#211 | 11.2%(+0.554)#9,844 |
| 7. | 66615 | 11.1% | 11.3%(-0.152)#256 | 11.2%(-0.082)#11,292 |
| 8. | 66609 | 10.7% | 11.3%(-0.563)#279 | 11.2%(-0.492)#12,314 |
| 9. | 66603 | 10.3% | 11.3%(-1.03)#308 | 11.2%(-0.962)#13,480 |
| 10. | 66617 | 10.2% | 11.3%(-1.11)#315 | 11.2%(-1.04)#13,667 |
| 11. | 66605 | 7.8% | 11.3%(-3.45)#435 | 11.2%(-3.38)#20,070 |
| 12. | 66619 | 7.4% | 11.3%(-3.90)#465 | 11.2%(-3.83)#21,183 |
| 13. | 66608 | 6.3% | 11.3%(-4.98)#507 | 11.2%(-4.91)#23,718 |
| 14. | 66621 | 5.7% | 11.3%(-5.58)#530 | 11.2%(-5.51)#24,969 |
| 15. | 66616 | 5.6% | 11.3%(-5.71)#537 | 11.2%(-5.64)#25,199 |
| 16. | 66612 | 5.5% | 11.3%(-5.82)#541 | 11.2%(-5.75)#25,401 |
| 17. | 66607 | 4.2% | 11.3%(-7.11)#584 | 11.2%(-7.04)#27,326 |
1
Common Questions
What are the Top 10 Zip Codes with the Highest Percentage of Population Employed in Community & Social Service in Topeka, KS?
Top 10 Zip Codes with the Highest Percentage of Population Employed in Community & Social Service in Topeka, KS are:
What zip code has the Highest Percentage of Population Employed in Community & Social Service in Topeka, KS?
66610 has the Highest Percentage of Population Employed in Community & Social Service in Topeka, KS with 13.7%.
What is the Percentage of Population Employed in Community & Social Service in Topeka, KS?
Percentage of Population Employed in Community & Social Service in Topeka is 10.4%.
What is the Percentage of Population Employed in Community & Social Service in Kansas?
Percentage of Population Employed in Community & Social Service in Kansas is 11.3%.
What is the Percentage of Population Employed in Community & Social Service in the United States?
Percentage of Population Employed in Community & Social Service in the United States is 11.2%.