Zip Codes with the Highest Percentage of Households Without a Vehicle in Shawnee, KS
RELATED REPORTS & OPTIONS
Households without a Cars
Shawnee
Compare Zip Codes
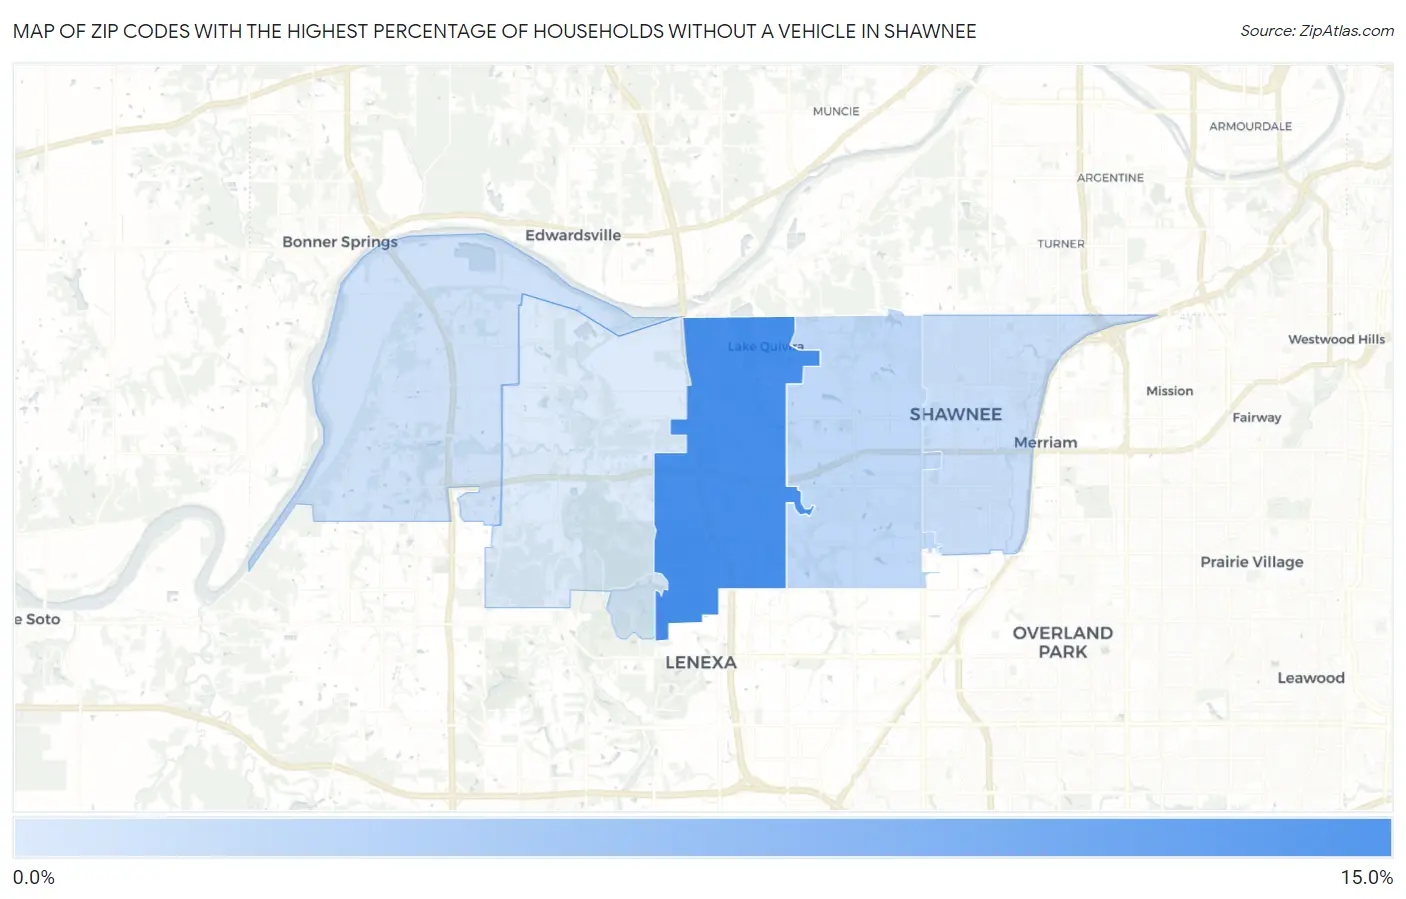
Map of Zip Codes with the Highest Percentage of Households Without a Vehicle in Shawnee
0.0%
15.0%
Zip Codes with the Highest Percentage of Households Without a Vehicle in Shawnee, KS
| Zip Code | Housholds Without a Car | vs State | vs National | |
| 1. | 66217 | 10.7% | 5.1%(+5.60)#29 | 8.3%(+2.40)#4,339 |
| 2. | 66216 | 3.1% | 5.1%(-2.00)#299 | 8.3%(-5.20)#18,745 |
| 3. | 66203 | 2.6% | 5.1%(-2.50)#336 | 8.3%(-5.70)#20,444 |
| 4. | 66226 | 2.2% | 5.1%(-2.90)#383 | 8.3%(-6.10)#21,772 |
| 5. | 66218 | 1.3% | 5.1%(-3.80)#454 | 8.3%(-7.00)#24,791 |
1
Common Questions
What are the Top 3 Zip Codes with the Highest Percentage of Households Without a Vehicle in Shawnee, KS?
Top 3 Zip Codes with the Highest Percentage of Households Without a Vehicle in Shawnee, KS are:
What zip code has the Highest Percentage of Households Without a Vehicle in Shawnee, KS?
66217 has the Highest Percentage of Households Without a Vehicle in Shawnee, KS with 10.7%.
What is the Percentage of Households Without a Vehicle in Shawnee, KS?
Percentage of Households Without a Vehicle in Shawnee is 3.6%.
What is the Percentage of Households Without a Vehicle in Kansas?
Percentage of Households Without a Vehicle in Kansas is 5.1%.
What is the Percentage of Households Without a Vehicle in the United States?
Percentage of Households Without a Vehicle in the United States is 8.3%.