Zip Codes with the Highest Percentage of Population with a Degree in Liberal Arts and History in Shawnee, KS
RELATED REPORTS & OPTIONS
Liberal Arts and History
Shawnee
Compare Zip Codes
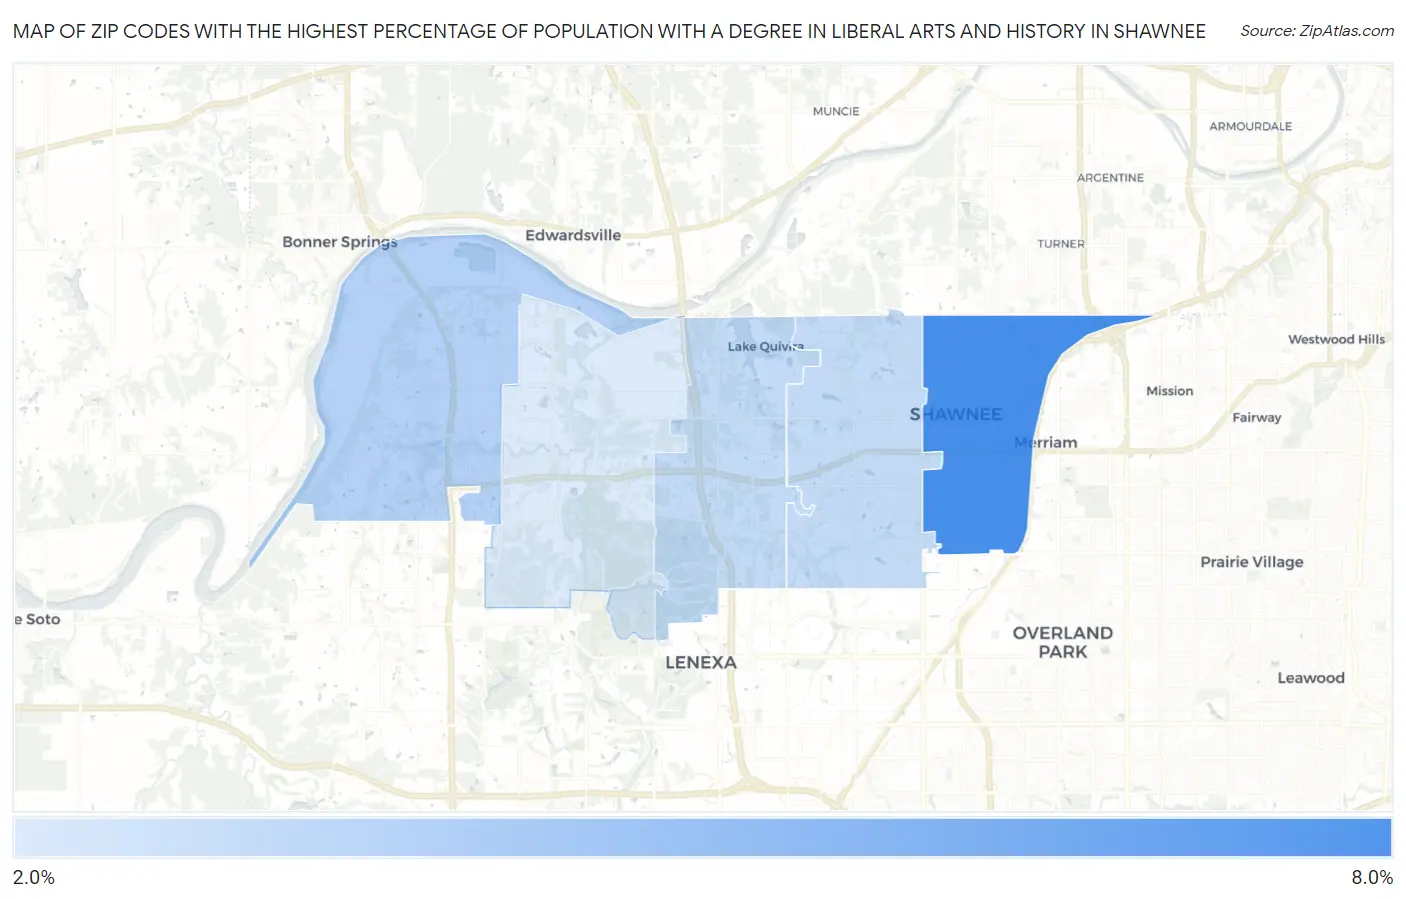
Map of Zip Codes with the Highest Percentage of Population with a Degree in Liberal Arts and History in Shawnee
0.0%
8.0%
Zip Codes with the Highest Percentage of Population with a Degree in Liberal Arts and History in Shawnee, KS
| Zip Code | % Graduates | vs State | vs National | |
| 1. | 66203 | 6.7% | 4.6%(+2.13)#141 | 4.9%(+1.82)#6,968 |
| 2. | 66226 | 3.5% | 4.6%(-1.09)#301 | 4.9%(-1.40)#16,694 |
| 3. | 66217 | 3.0% | 4.6%(-1.56)#331 | 4.9%(-1.88)#18,373 |
| 4. | 66216 | 3.0% | 4.6%(-1.60)#337 | 4.9%(-1.91)#18,497 |
| 5. | 66218 | 2.3% | 4.6%(-2.31)#381 | 4.9%(-2.62)#20,679 |
1
Common Questions
What are the Top 3 Zip Codes with the Highest Percentage of Population with a Degree in Liberal Arts and History in Shawnee, KS?
Top 3 Zip Codes with the Highest Percentage of Population with a Degree in Liberal Arts and History in Shawnee, KS are:
What zip code has the Highest Percentage of Population with a Degree in Liberal Arts and History in Shawnee, KS?
66203 has the Highest Percentage of Population with a Degree in Liberal Arts and History in Shawnee, KS with 6.7%.
What is the Percentage of Population with a Degree in Liberal Arts and History in Shawnee, KS?
Percentage of Population with a Degree in Liberal Arts and History in Shawnee is 3.7%.
What is the Percentage of Population with a Degree in Liberal Arts and History in Kansas?
Percentage of Population with a Degree in Liberal Arts and History in Kansas is 4.6%.
What is the Percentage of Population with a Degree in Liberal Arts and History in the United States?
Percentage of Population with a Degree in Liberal Arts and History in the United States is 4.9%.