Zip Codes with the Highest Percentage of Population Employed in Health Diagnosing & Treating in Mission, KS
RELATED REPORTS & OPTIONS
Health Diagnosing & Treating
Mission
Compare Zip Codes
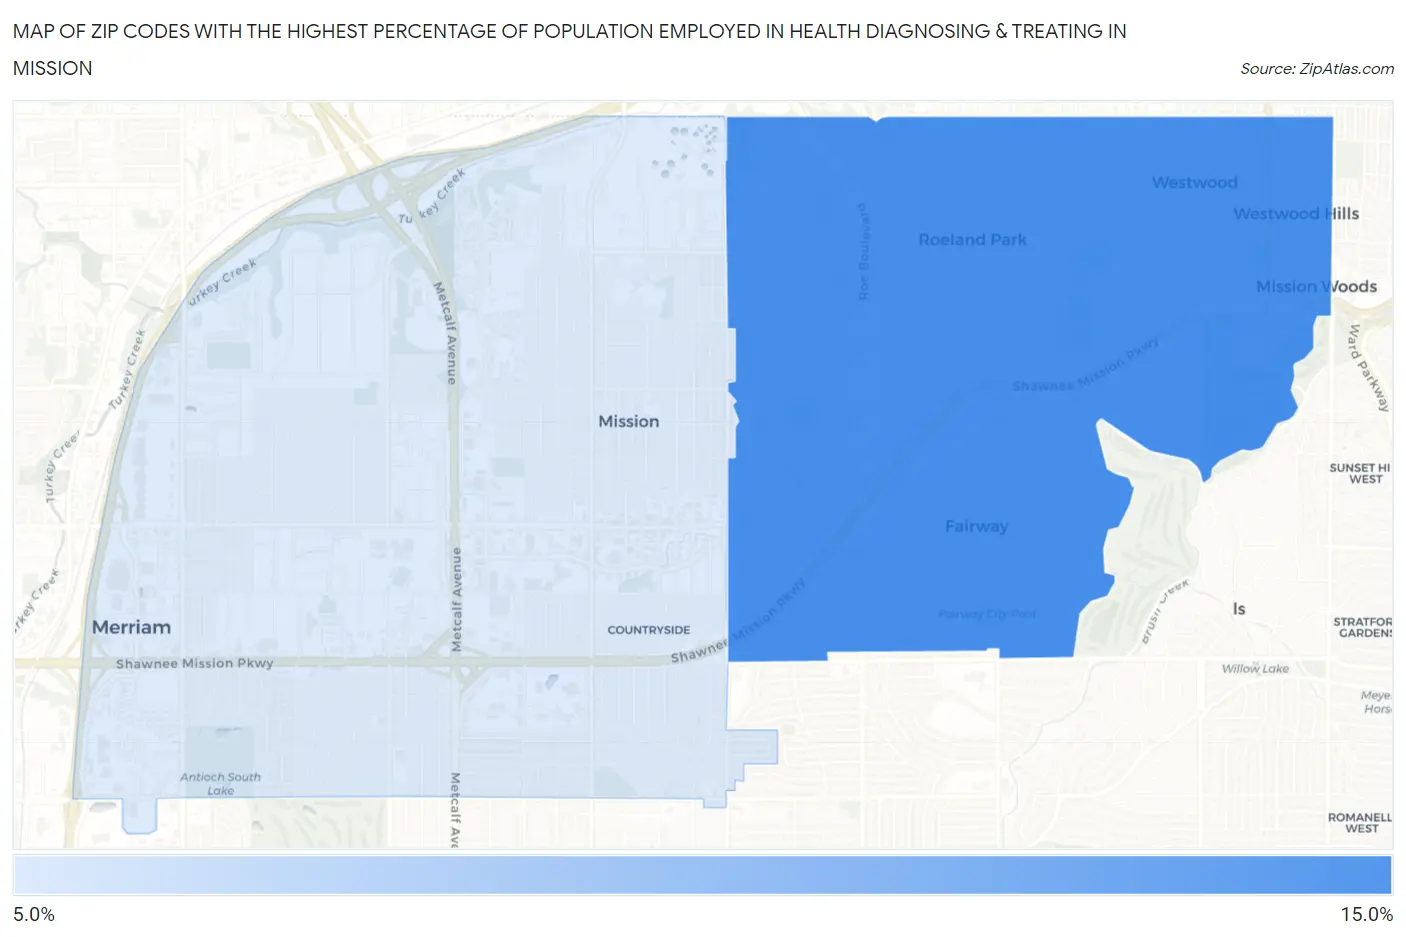
Map of Zip Codes with the Highest Percentage of Population Employed in Health Diagnosing & Treating in Mission
0.0%
15.0%
Zip Codes with the Highest Percentage of Population Employed in Health Diagnosing & Treating in Mission, KS
| Zip Code | % Employed | vs State | vs National | |
| 1. | 66205 | 12.8% | 6.6%(+6.16)#42 | 6.2%(+6.51)#1,846 |
| 2. | 66202 | 7.1% | 6.6%(+0.511)#217 | 6.2%(+0.862)#10,011 |
1
Common Questions
What are the Top Zip Codes with the Highest Percentage of Population Employed in Health Diagnosing & Treating in Mission, KS?
Top Zip Codes with the Highest Percentage of Population Employed in Health Diagnosing & Treating in Mission, KS are:
What zip code has the Highest Percentage of Population Employed in Health Diagnosing & Treating in Mission, KS?
66205 has the Highest Percentage of Population Employed in Health Diagnosing & Treating in Mission, KS with 12.8%.
What is the Percentage of Population Employed in Health Diagnosing & Treating in Mission, KS?
Percentage of Population Employed in Health Diagnosing & Treating in Mission is 7.1%.
What is the Percentage of Population Employed in Health Diagnosing & Treating in Kansas?
Percentage of Population Employed in Health Diagnosing & Treating in Kansas is 6.6%.
What is the Percentage of Population Employed in Health Diagnosing & Treating in the United States?
Percentage of Population Employed in Health Diagnosing & Treating in the United States is 6.2%.