Zip Codes with the Highest Percentage of Population Employed in Health Diagnosing & Treating in Leawood, KS
RELATED REPORTS & OPTIONS
Health Diagnosing & Treating
Leawood
Compare Zip Codes
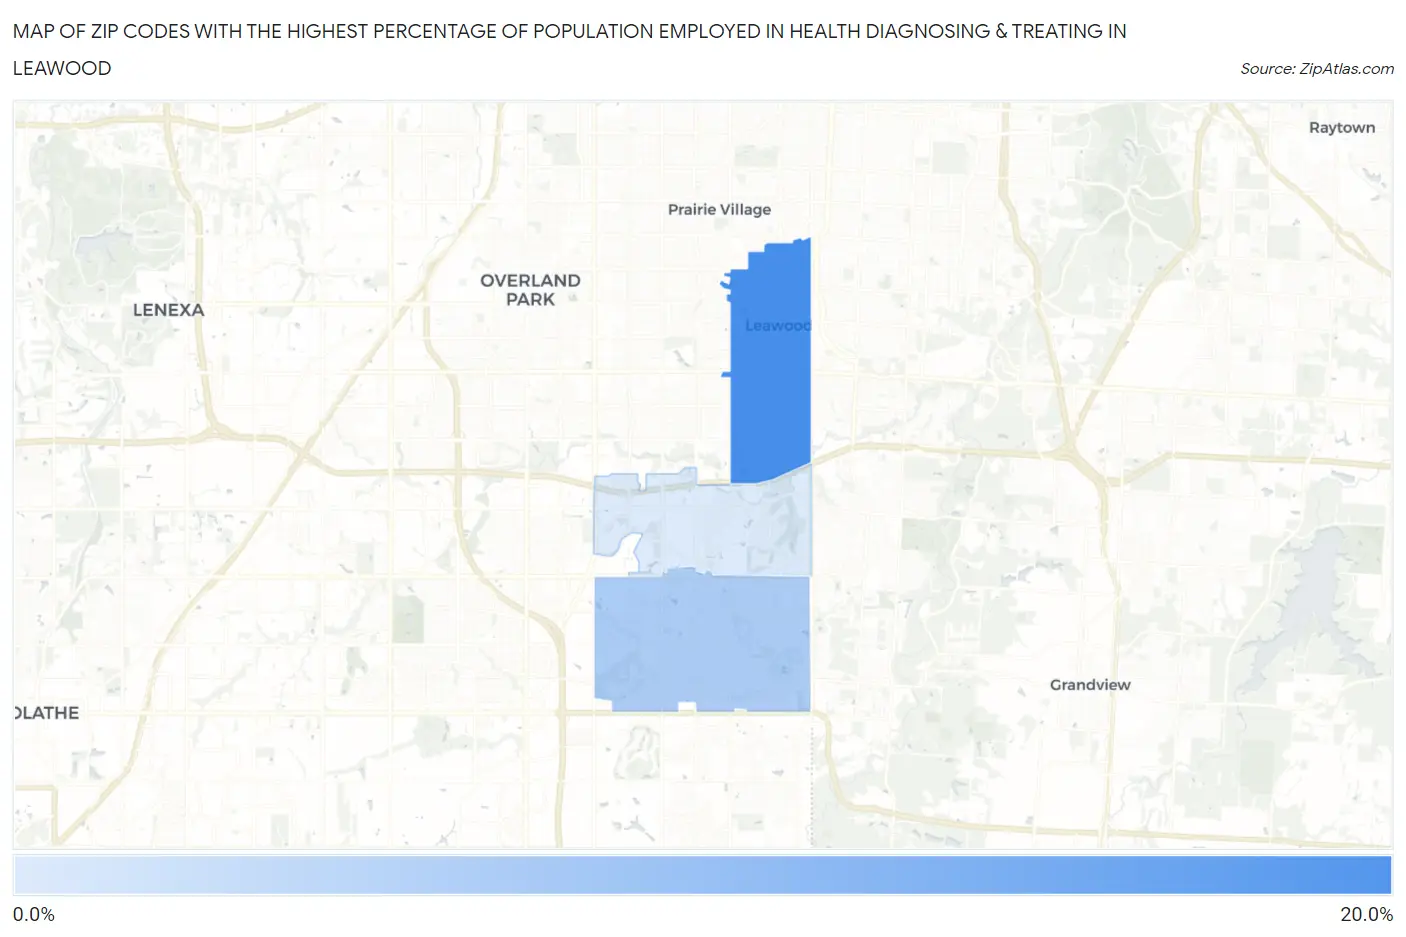
Map of Zip Codes with the Highest Percentage of Population Employed in Health Diagnosing & Treating in Leawood
0.0%
20.0%
Zip Codes with the Highest Percentage of Population Employed in Health Diagnosing & Treating in Leawood, KS
| Zip Code | % Employed | vs State | vs National | |
| 1. | 66206 | 15.5% | 6.6%(+8.86)#21 | 6.2%(+9.21)#1,047 |
| 2. | 66209 | 9.9% | 6.6%(+3.35)#98 | 6.2%(+3.70)#3,956 |
| 3. | 66211 | 7.3% | 6.6%(+0.741)#207 | 6.2%(+1.09)#9,301 |
1
Common Questions
What are the Top Zip Codes with the Highest Percentage of Population Employed in Health Diagnosing & Treating in Leawood, KS?
Top Zip Codes with the Highest Percentage of Population Employed in Health Diagnosing & Treating in Leawood, KS are:
What zip code has the Highest Percentage of Population Employed in Health Diagnosing & Treating in Leawood, KS?
66206 has the Highest Percentage of Population Employed in Health Diagnosing & Treating in Leawood, KS with 15.5%.
What is the Percentage of Population Employed in Health Diagnosing & Treating in Leawood, KS?
Percentage of Population Employed in Health Diagnosing & Treating in Leawood is 13.8%.
What is the Percentage of Population Employed in Health Diagnosing & Treating in Kansas?
Percentage of Population Employed in Health Diagnosing & Treating in Kansas is 6.6%.
What is the Percentage of Population Employed in Health Diagnosing & Treating in the United States?
Percentage of Population Employed in Health Diagnosing & Treating in the United States is 6.2%.