Zip Codes with the Highest Percentage of Population Employed in Health Diagnosing & Treating in Hutchinson, KS
RELATED REPORTS & OPTIONS
Health Diagnosing & Treating
Hutchinson
Compare Zip Codes
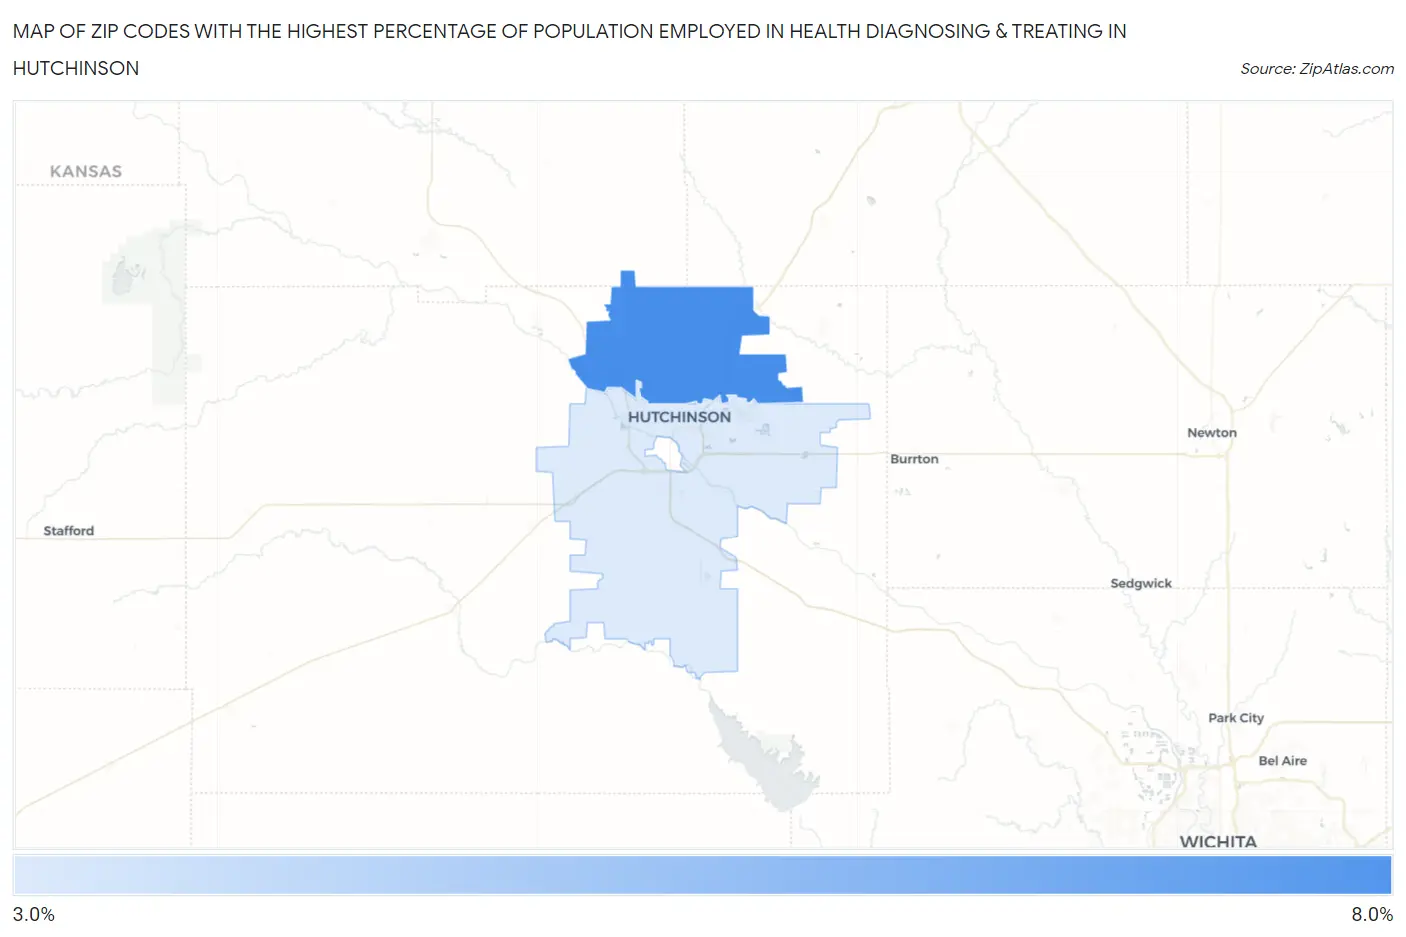
Map of Zip Codes with the Highest Percentage of Population Employed in Health Diagnosing & Treating in Hutchinson
0.0%
8.0%
Zip Codes with the Highest Percentage of Population Employed in Health Diagnosing & Treating in Hutchinson, KS
| Zip Code | % Employed | vs State | vs National | |
| 1. | 67502 | 6.5% | 6.6%(-0.075)#254 | 6.2%(+0.276)#11,955 |
| 2. | 67501 | 3.7% | 6.6%(-2.93)#451 | 6.2%(-2.58)#22,391 |
1
Common Questions
What are the Top Zip Codes with the Highest Percentage of Population Employed in Health Diagnosing & Treating in Hutchinson, KS?
Top Zip Codes with the Highest Percentage of Population Employed in Health Diagnosing & Treating in Hutchinson, KS are:
What zip code has the Highest Percentage of Population Employed in Health Diagnosing & Treating in Hutchinson, KS?
67502 has the Highest Percentage of Population Employed in Health Diagnosing & Treating in Hutchinson, KS with 6.5%.
What is the Percentage of Population Employed in Health Diagnosing & Treating in Hutchinson, KS?
Percentage of Population Employed in Health Diagnosing & Treating in Hutchinson is 4.8%.
What is the Percentage of Population Employed in Health Diagnosing & Treating in Kansas?
Percentage of Population Employed in Health Diagnosing & Treating in Kansas is 6.6%.
What is the Percentage of Population Employed in Health Diagnosing & Treating in the United States?
Percentage of Population Employed in Health Diagnosing & Treating in the United States is 6.2%.