Zip Codes with the Highest Percentage of Population Employed in Security & Protection in Hutchinson, KS
RELATED REPORTS & OPTIONS
Security & Protection
Hutchinson
Compare Zip Codes
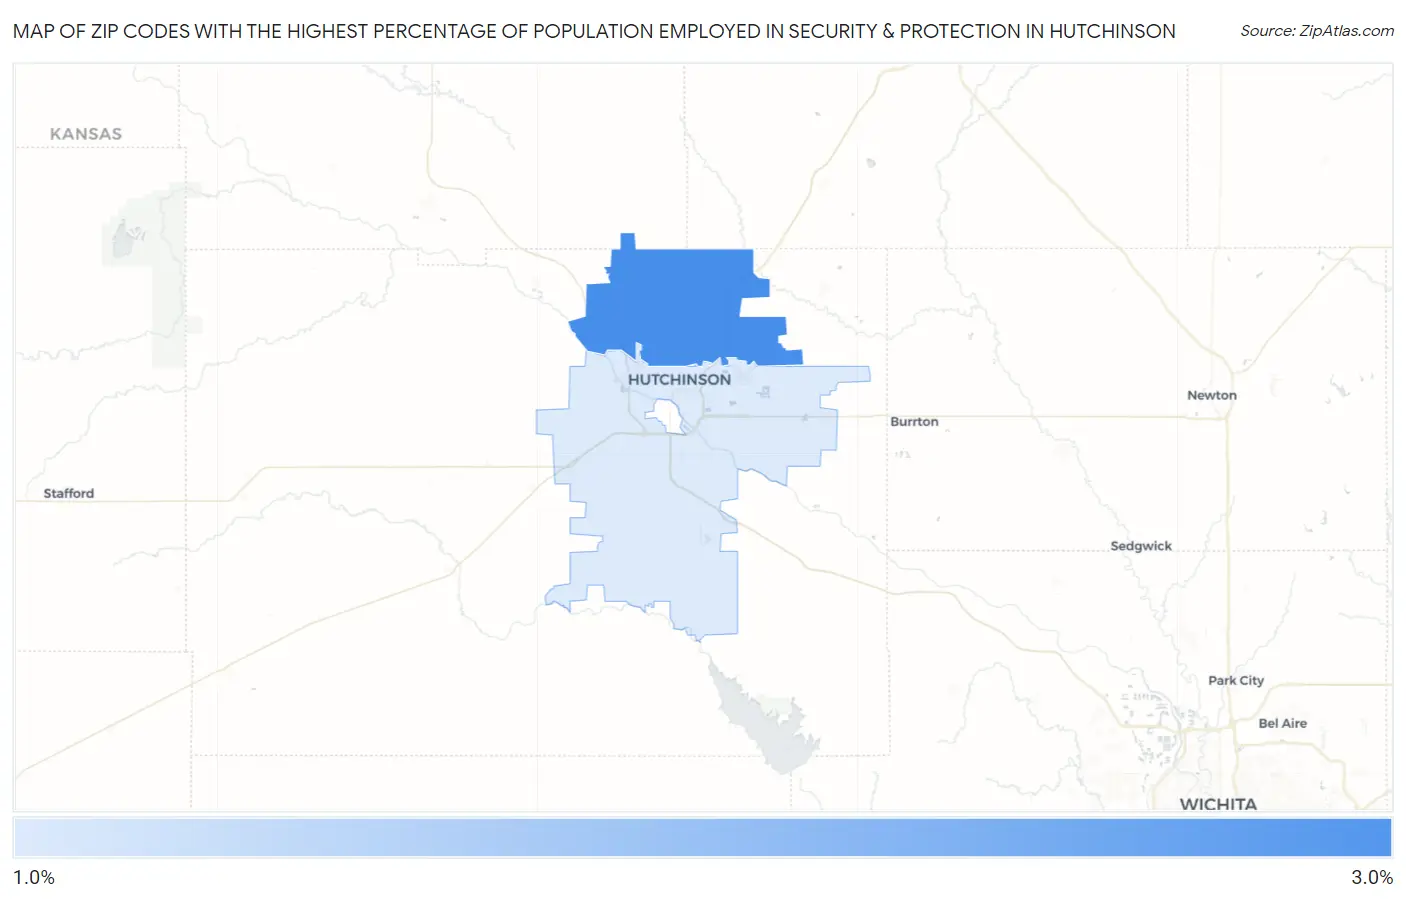
Map of Zip Codes with the Highest Percentage of Population Employed in Security & Protection in Hutchinson
0.0%
3.0%
Zip Codes with the Highest Percentage of Population Employed in Security & Protection in Hutchinson, KS
| Zip Code | % Employed | vs State | vs National | |
| 1. | 67502 | 2.6% | 1.8%(+0.873)#141 | 2.1%(+0.500)#8,770 |
| 2. | 67501 | 1.7% | 1.8%(-0.074)#242 | 2.1%(-0.448)#14,680 |
1
Common Questions
What are the Top Zip Codes with the Highest Percentage of Population Employed in Security & Protection in Hutchinson, KS?
Top Zip Codes with the Highest Percentage of Population Employed in Security & Protection in Hutchinson, KS are:
What zip code has the Highest Percentage of Population Employed in Security & Protection in Hutchinson, KS?
67502 has the Highest Percentage of Population Employed in Security & Protection in Hutchinson, KS with 2.6%.
What is the Percentage of Population Employed in Security & Protection in Hutchinson, KS?
Percentage of Population Employed in Security & Protection in Hutchinson is 1.9%.
What is the Percentage of Population Employed in Security & Protection in Kansas?
Percentage of Population Employed in Security & Protection in Kansas is 1.8%.
What is the Percentage of Population Employed in Security & Protection in the United States?
Percentage of Population Employed in Security & Protection in the United States is 2.1%.