Croatian vs Luxembourger Wage/Income Gap
COMPARE
Croatian
Luxembourger
Wage/Income Gap
Wage/Income Gap Comparison
Croatians
Luxembourgers
29.0%
WAGE/INCOME GAP
0.0/ 100
METRIC RATING
324th/ 347
METRIC RANK
27.4%
WAGE/INCOME GAP
1.9/ 100
METRIC RATING
257th/ 347
METRIC RANK
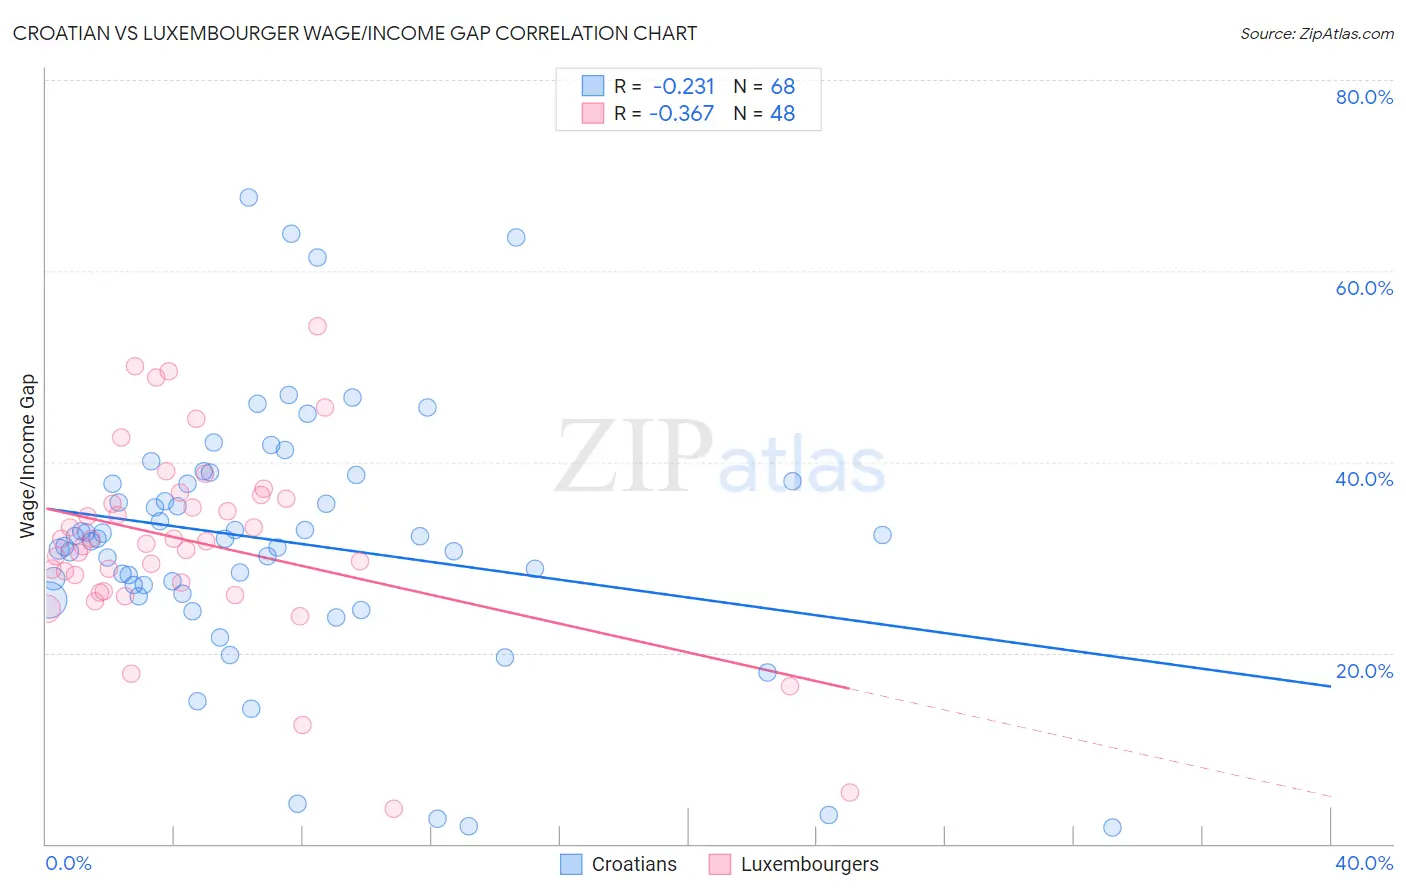
Croatian vs Luxembourger Wage/Income Gap Correlation Chart
The statistical analysis conducted on geographies consisting of 375,417,057 people shows a weak negative correlation between the proportion of Croatians and wage/income gap percentage in the United States with a correlation coefficient (R) of -0.231 and weighted average of 29.0%. Similarly, the statistical analysis conducted on geographies consisting of 144,643,301 people shows a mild negative correlation between the proportion of Luxembourgers and wage/income gap percentage in the United States with a correlation coefficient (R) of -0.367 and weighted average of 27.4%, a difference of 5.7%.
Wage/Income Gap Correlation Summary
| Measurement | Croatian | Luxembourger |
| Minimum | 1.8% | 3.7% |
| Maximum | 67.7% | 54.2% |
| Range | 65.9% | 50.5% |
| Mean | 31.7% | 31.6% |
| Median | 31.9% | 31.6% |
| Interquartile 25% (IQ1) | 26.6% | 26.9% |
| Interquartile 75% (IQ3) | 37.8% | 36.3% |
| Interquartile Range (IQR) | 11.2% | 9.5% |
| Standard Deviation (Sample) | 13.2% | 10.1% |
| Standard Deviation (Population) | 13.2% | 10.0% |
Similar Demographics by Wage/Income Gap
Demographics Similar to Croatians by Wage/Income Gap
In terms of wage/income gap, the demographic groups most similar to Croatians are Norwegian (29.0%, a difference of 0.12%), Hungarian (29.0%, a difference of 0.13%), Immigrants from Belgium (29.0%, a difference of 0.20%), Immigrants from Singapore (28.9%, a difference of 0.23%), and Welsh (28.9%, a difference of 0.25%).
| Demographics | Rating | Rank | Wage/Income Gap |
| Belgians | 0.1 /100 | #317 | Tragic 28.8% |
| Basques | 0.1 /100 | #318 | Tragic 28.8% |
| Slovaks | 0.1 /100 | #319 | Tragic 28.9% |
| British | 0.1 /100 | #320 | Tragic 28.9% |
| Welsh | 0.1 /100 | #321 | Tragic 28.9% |
| Immigrants | Singapore | 0.1 /100 | #322 | Tragic 28.9% |
| Norwegians | 0.1 /100 | #323 | Tragic 29.0% |
| Croatians | 0.0 /100 | #324 | Tragic 29.0% |
| Hungarians | 0.0 /100 | #325 | Tragic 29.0% |
| Immigrants | Belgium | 0.0 /100 | #326 | Tragic 29.0% |
| Immigrants | Iran | 0.0 /100 | #327 | Tragic 29.1% |
| Scandinavians | 0.0 /100 | #328 | Tragic 29.1% |
| Scottish | 0.0 /100 | #329 | Tragic 29.1% |
| Germans | 0.0 /100 | #330 | Tragic 29.2% |
| Czechs | 0.0 /100 | #331 | Tragic 29.2% |
Demographics Similar to Luxembourgers by Wage/Income Gap
In terms of wage/income gap, the demographic groups most similar to Luxembourgers are Slavic (27.4%, a difference of 0.040%), Cherokee (27.4%, a difference of 0.050%), Icelander (27.5%, a difference of 0.11%), Tongan (27.5%, a difference of 0.13%), and Immigrants from France (27.4%, a difference of 0.15%).
| Demographics | Rating | Rank | Wage/Income Gap |
| Immigrants | Czechoslovakia | 2.7 /100 | #250 | Tragic 27.3% |
| Immigrants | Norway | 2.5 /100 | #251 | Tragic 27.3% |
| Ukrainians | 2.4 /100 | #252 | Tragic 27.3% |
| Portuguese | 2.2 /100 | #253 | Tragic 27.4% |
| Israelis | 2.1 /100 | #254 | Tragic 27.4% |
| Immigrants | France | 2.1 /100 | #255 | Tragic 27.4% |
| Cherokee | 1.9 /100 | #256 | Tragic 27.4% |
| Luxembourgers | 1.9 /100 | #257 | Tragic 27.4% |
| Slavs | 1.8 /100 | #258 | Tragic 27.4% |
| Icelanders | 1.8 /100 | #259 | Tragic 27.5% |
| Tongans | 1.7 /100 | #260 | Tragic 27.5% |
| Immigrants | Germany | 1.5 /100 | #261 | Tragic 27.5% |
| Immigrants | Lebanon | 1.5 /100 | #262 | Tragic 27.5% |
| Syrians | 1.4 /100 | #263 | Tragic 27.6% |
| Immigrants | Switzerland | 1.0 /100 | #264 | Tragic 27.7% |