Creek vs Immigrants from Costa Rica Median Family Income
COMPARE
Creek
Immigrants from Costa Rica
Median Family Income
Median Family Income Comparison
Creek
Immigrants from Costa Rica
$82,560
MEDIAN FAMILY INCOME
0.0/ 100
METRIC RATING
324th/ 347
METRIC RANK
$101,354
MEDIAN FAMILY INCOME
33.7/ 100
METRIC RATING
184th/ 347
METRIC RANK
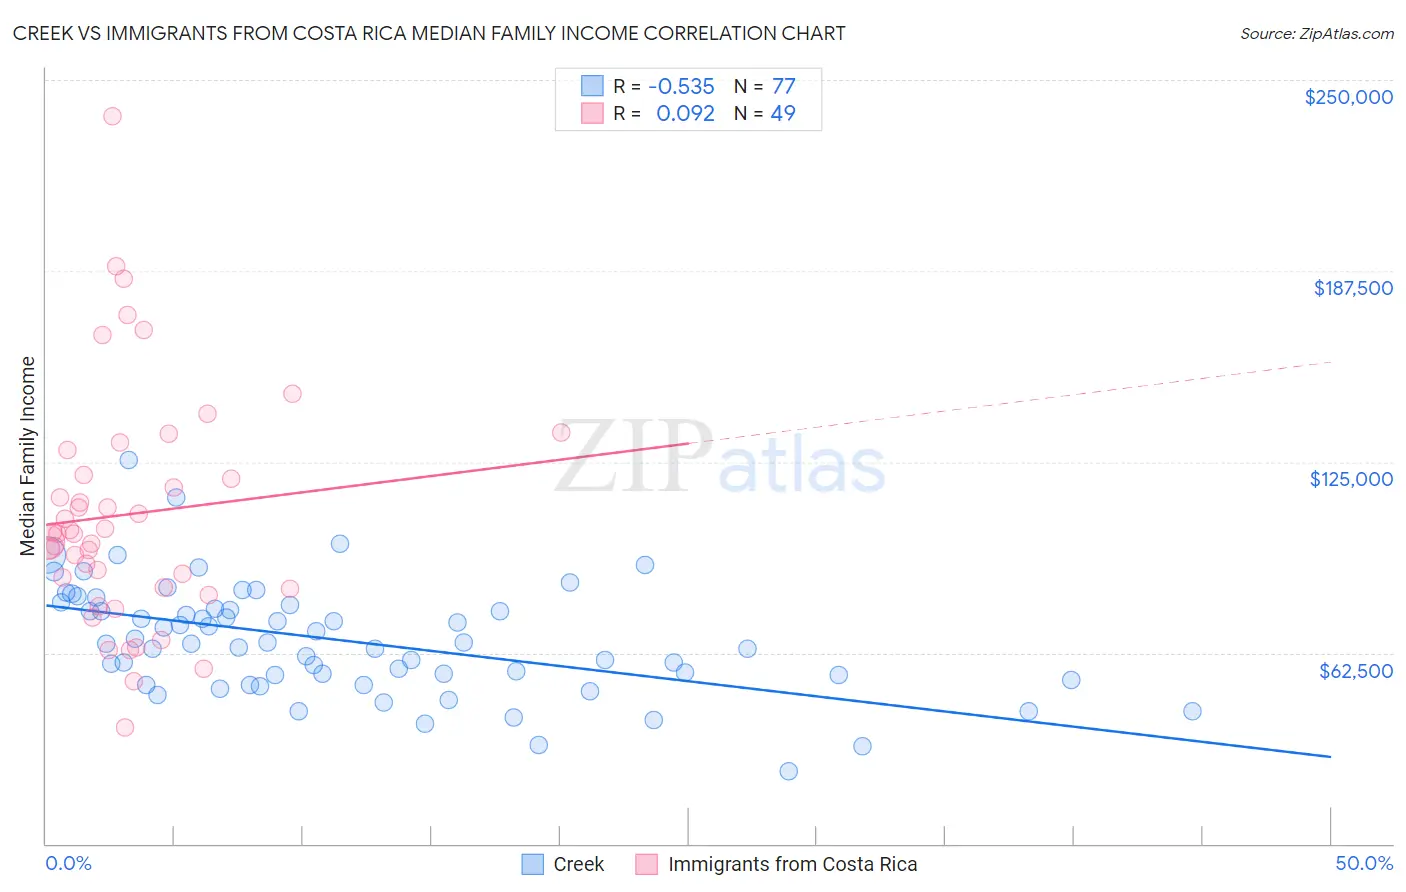
Creek vs Immigrants from Costa Rica Median Family Income Correlation Chart
The statistical analysis conducted on geographies consisting of 178,420,625 people shows a substantial negative correlation between the proportion of Creek and median family income in the United States with a correlation coefficient (R) of -0.535 and weighted average of $82,560. Similarly, the statistical analysis conducted on geographies consisting of 204,217,887 people shows a slight positive correlation between the proportion of Immigrants from Costa Rica and median family income in the United States with a correlation coefficient (R) of 0.092 and weighted average of $101,354, a difference of 22.8%.
Median Family Income Correlation Summary
| Measurement | Creek | Immigrants from Costa Rica |
| Minimum | $23,750 | $37,917 |
| Maximum | $125,671 | $238,052 |
| Range | $101,921 | $200,135 |
| Mean | $66,532 | $107,880 |
| Median | $65,440 | $101,496 |
| Interquartile 25% (IQ1) | $54,458 | $83,552 |
| Interquartile 75% (IQ3) | $77,450 | $124,823 |
| Interquartile Range (IQR) | $22,992 | $41,271 |
| Standard Deviation (Sample) | $18,322 | $38,589 |
| Standard Deviation (Population) | $18,202 | $38,194 |
Similar Demographics by Median Family Income
Demographics Similar to Creek by Median Family Income
In terms of median family income, the demographic groups most similar to Creek are Bahamian ($82,631, a difference of 0.090%), Sioux ($82,386, a difference of 0.21%), Dominican ($82,888, a difference of 0.40%), Immigrants from Congo ($82,216, a difference of 0.42%), and Arapaho ($82,064, a difference of 0.61%).
| Demographics | Rating | Rank | Median Family Income |
| Yakama | 0.0 /100 | #317 | Tragic $83,932 |
| Immigrants | Mexico | 0.0 /100 | #318 | Tragic $83,639 |
| Immigrants | Honduras | 0.0 /100 | #319 | Tragic $83,618 |
| Seminole | 0.0 /100 | #320 | Tragic $83,354 |
| Immigrants | Caribbean | 0.0 /100 | #321 | Tragic $83,319 |
| Dominicans | 0.0 /100 | #322 | Tragic $82,888 |
| Bahamians | 0.0 /100 | #323 | Tragic $82,631 |
| Creek | 0.0 /100 | #324 | Tragic $82,560 |
| Sioux | 0.0 /100 | #325 | Tragic $82,386 |
| Immigrants | Congo | 0.0 /100 | #326 | Tragic $82,216 |
| Arapaho | 0.0 /100 | #327 | Tragic $82,064 |
| Blacks/African Americans | 0.0 /100 | #328 | Tragic $81,912 |
| Dutch West Indians | 0.0 /100 | #329 | Tragic $81,852 |
| Cheyenne | 0.0 /100 | #330 | Tragic $81,385 |
| Immigrants | Dominican Republic | 0.0 /100 | #331 | Tragic $81,233 |
Demographics Similar to Immigrants from Costa Rica by Median Family Income
In terms of median family income, the demographic groups most similar to Immigrants from Costa Rica are Kenyan ($101,417, a difference of 0.060%), Dutch ($101,192, a difference of 0.16%), Tsimshian ($101,543, a difference of 0.19%), Celtic ($101,139, a difference of 0.21%), and Spaniard ($101,617, a difference of 0.26%).
| Demographics | Rating | Rank | Median Family Income |
| Germans | 44.6 /100 | #177 | Average $102,254 |
| Welsh | 43.3 /100 | #178 | Average $102,151 |
| South Americans | 39.7 /100 | #179 | Fair $101,856 |
| French Canadians | 37.0 /100 | #180 | Fair $101,634 |
| Spaniards | 36.8 /100 | #181 | Fair $101,617 |
| Tsimshian | 35.9 /100 | #182 | Fair $101,543 |
| Kenyans | 34.5 /100 | #183 | Fair $101,417 |
| Immigrants | Costa Rica | 33.7 /100 | #184 | Fair $101,354 |
| Dutch | 31.9 /100 | #185 | Fair $101,192 |
| Celtics | 31.3 /100 | #186 | Fair $101,139 |
| Tlingit-Haida | 30.8 /100 | #187 | Fair $101,092 |
| Guamanians/Chamorros | 30.5 /100 | #188 | Fair $101,061 |
| Immigrants | Portugal | 29.6 /100 | #189 | Fair $100,984 |
| Immigrants | Immigrants | 29.4 /100 | #190 | Fair $100,962 |
| Colombians | 27.2 /100 | #191 | Fair $100,750 |