Creek vs Immigrants from Bahamas Median Family Income

COMPARE

Creek
Race
Ancestry
AfghanAfricanAlaska NativeAlaskan AthabascanAlbanianAleutAlsatianAmericanApacheArabArapahoArgentineanArmenianAssyrian/Chaldean/SyriacAustralianAustrianBahamianBangladeshiBarbadianBasqueBelgianBelizeanBermudanBhutaneseBlackfeetBolivianBrazilianBritishBritish West IndianBulgarianBurmeseCajunCambodianCanadianCape VerdeanCarpatho RusynCelticCentral AmericanCentral American IndianCherokeeCheyenneChickasawChileanChineseChippewaChoctawColombianColvilleComancheCosta RicanCreeCreekCroatianCrowCubanCypriotCzechCzechoslovakianDanishDelawareDominicanDutchDutch West IndianEastern EuropeanEcuadorianEgyptianEnglishEstonianEthiopianEuropeanFijianFilipinoFinnishFrenchFrench American IndianFrench CanadianGermanGerman RussianGhanaianGreekGuamanian/ChamorroGuatemalanGuyaneseHaitianHmongHonduranHopiHoumaHungarianIcelanderIndian (Asian)IndonesianInupiatIranianIraqiIrishIroquoisIsraeliItalianJamaicanJapaneseJordanianKenyanKiowaKoreanLaotianLatvianLebaneseLiberianLithuanianLumbeeLuxembourgerMacedonianMalaysianMalteseMarshalleseMenomineeMexicanMexican American IndianMongolianMoroccanNative HawaiianNavajoNepaleseNew ZealanderNicaraguanNigerianNorthern EuropeanNorwegianOkinawanOsageOttawaPaiutePakistaniPalestinianPanamanianParaguayanPennsylvania GermanPeruvianPimaPolishPortuguesePotawatomiPuebloPuerto RicanPuget Sound SalishRomanianRussianSalvadoranSamoanScandinavianScotch-IrishScottishSeminoleSenegaleseSerbianShoshoneSierra LeoneanSiouxSlavicSlovakSloveneSomaliSouth AfricanSouth AmericanSouth American IndianSoviet UnionSpaniardSpanishSpanish AmericanSpanish American IndianSri LankanSubsaharan AfricanSudaneseSwedishSwissSyrianTaiwaneseThaiTlingit-HaidaTohono O'OdhamTonganTrinidadian and TobagonianTsimshianTurkishU.S. Virgin IslanderUgandanUkrainianUruguayanUteVenezuelanVietnameseWelshWest IndianYakamaYaquiYugoslavianYumanYup'ikZimbabwean
Immigration
NonimmigrantsImmigrantsAfghanistanAfricaAlbaniaArgentinaArmeniaAsiaAustraliaAustriaBangladeshBarbadosBelarusBelgiumBelizeBoliviaBosnia and HerzegovinaBrazilBulgariaBurma/MyanmarCabo VerdeCambodiaCameroonCanadaCaribbeanCentral AmericaChileChinaColombiaCongoCosta RicaCroatiaCubaCzechoslovakiaDenmarkDominicaDominican RepublicEastern AfricaEastern AsiaEastern EuropeEcuadorEgyptEl SalvadorEnglandEritreaEthiopiaEuropeFijiFranceGermanyGhanaGreeceGrenadaGuatemalaGuyanaHaitiHondurasHong KongHungaryIndiaIndonesiaIranIraqIrelandIsraelItalyJamaicaJapanJordanKazakhstanKenyaKoreaKuwaitLaosLatin AmericaLatviaLebanonLiberiaLithuaniaMalaysiaMexicoMicronesiaMiddle AfricaMoldovaMoroccoNepalNetherlandsNicaraguaNigeriaNorth AmericaNorth MacedoniaNorthern AfricaNorthern EuropeNorwayOceaniaPakistanPanamaPeruPhilippinesPolandPortugalRomaniaRussiaSaudi ArabiaScotlandSenegalSerbiaSierra LeoneSingaporeSomaliaSouth AfricaSouth AmericaSouth Central AsiaSouth Eastern AsiaSouthern EuropeSpainSri LankaSt. Vincent and the GrenadinesSudanSwedenSwitzerlandSyriaTaiwanThailandTrinidad and TobagoTurkeyUgandaUkraineUruguayUzbekistanVenezuelaVietnamWest IndiesWestern AfricaWestern AsiaWestern EuropeYemenZaireZimbabweAzores
Immigrants from Bahamas
Race
Ancestry
AfghanAfricanAlaska NativeAlaskan AthabascanAlbanianAleutAlsatianAmericanApacheArabArapahoArgentineanArmenianAssyrian/Chaldean/SyriacAustralianAustrianBahamianBangladeshiBarbadianBasqueBelgianBelizeanBermudanBhutaneseBlackfeetBolivianBrazilianBritishBritish West IndianBulgarianBurmeseCajunCambodianCanadianCape VerdeanCarpatho RusynCelticCentral AmericanCentral American IndianCherokeeCheyenneChickasawChileanChineseChippewaChoctawColombianColvilleComancheCosta RicanCreeCroatianCrowCubanCypriotCzechCzechoslovakianDanishDelawareDominicanDutchDutch West IndianEastern EuropeanEcuadorianEgyptianEnglishEstonianEthiopianEuropeanFijianFilipinoFinnishFrenchFrench American IndianFrench CanadianGermanGerman RussianGhanaianGreekGuamanian/ChamorroGuatemalanGuyaneseHaitianHmongHonduranHopiHoumaHungarianIcelanderIndian (Asian)IndonesianInupiatIranianIraqiIrishIroquoisIsraeliItalianJamaicanJapaneseJordanianKenyanKiowaKoreanLaotianLatvianLebaneseLiberianLithuanianLumbeeLuxembourgerMacedonianMalaysianMalteseMarshalleseMenomineeMexicanMexican American IndianMongolianMoroccanNative HawaiianNavajoNepaleseNew ZealanderNicaraguanNigerianNorthern EuropeanNorwegianOkinawanOsageOttawaPaiutePakistaniPalestinianPanamanianParaguayanPennsylvania GermanPeruvianPimaPolishPortuguesePotawatomiPuebloPuerto RicanPuget Sound SalishRomanianRussianSalvadoranSamoanScandinavianScotch-IrishScottishSeminoleSenegaleseSerbianShoshoneSierra LeoneanSiouxSlavicSlovakSloveneSomaliSouth AfricanSouth AmericanSouth American IndianSoviet UnionSpaniardSpanishSpanish AmericanSpanish American IndianSri LankanSubsaharan AfricanSudaneseSwedishSwissSyrianTaiwaneseThaiTlingit-HaidaTohono O'OdhamTonganTrinidadian and TobagonianTsimshianTurkishU.S. Virgin IslanderUgandanUkrainianUruguayanUteVenezuelanVietnameseWelshWest IndianYakamaYaquiYugoslavianYumanYup'ikZimbabwean
Immigration
NonimmigrantsImmigrantsAfghanistanAfricaAlbaniaArgentinaArmeniaAsiaAustraliaAustriaBahamasBangladeshBarbadosBelarusBelgiumBelizeBoliviaBosnia and HerzegovinaBrazilBulgariaBurma/MyanmarCabo VerdeCambodiaCameroonCanadaCaribbeanCentral AmericaChileChinaColombiaCongoCosta RicaCroatiaCubaCzechoslovakiaDenmarkDominicaDominican RepublicEastern AfricaEastern AsiaEastern EuropeEcuadorEgyptEl SalvadorEnglandEritreaEthiopiaEuropeFijiFranceGermanyGhanaGreeceGrenadaGuatemalaGuyanaHaitiHondurasHong KongHungaryIndiaIndonesiaIranIraqIrelandIsraelItalyJamaicaJapanJordanKazakhstanKenyaKoreaKuwaitLaosLatin AmericaLatviaLebanonLiberiaLithuaniaMalaysiaMexicoMicronesiaMiddle AfricaMoldovaMoroccoNepalNetherlandsNicaraguaNigeriaNorth AmericaNorth MacedoniaNorthern AfricaNorthern EuropeNorwayOceaniaPakistanPanamaPeruPhilippinesPolandPortugalRomaniaRussiaSaudi ArabiaScotlandSenegalSerbiaSierra LeoneSingaporeSomaliaSouth AfricaSouth AmericaSouth Central AsiaSouth Eastern AsiaSouthern EuropeSpainSri LankaSt. Vincent and the GrenadinesSudanSwedenSwitzerlandSyriaTaiwanThailandTrinidad and TobagoTurkeyUgandaUkraineUruguayUzbekistanVenezuelaVietnamWest IndiesWestern AfricaWestern AsiaWestern EuropeYemenZaireZimbabweAzores
Median Family Income
Income
Poverty
Unemployment
Labor Participation
Family Structure
Vehicle Availability
Education Level
Disability

Median Family Income Comparison

Creek

Immigrants from Bahamas

Tragic
Tragic
$82,560
MEDIAN FAMILY INCOME
0.0/ 100
METRIC RATING
324th/ 347
METRIC RANK
$84,732
MEDIAN FAMILY INCOME
0.0/ 100
METRIC RATING
314th/ 347
METRIC RANK

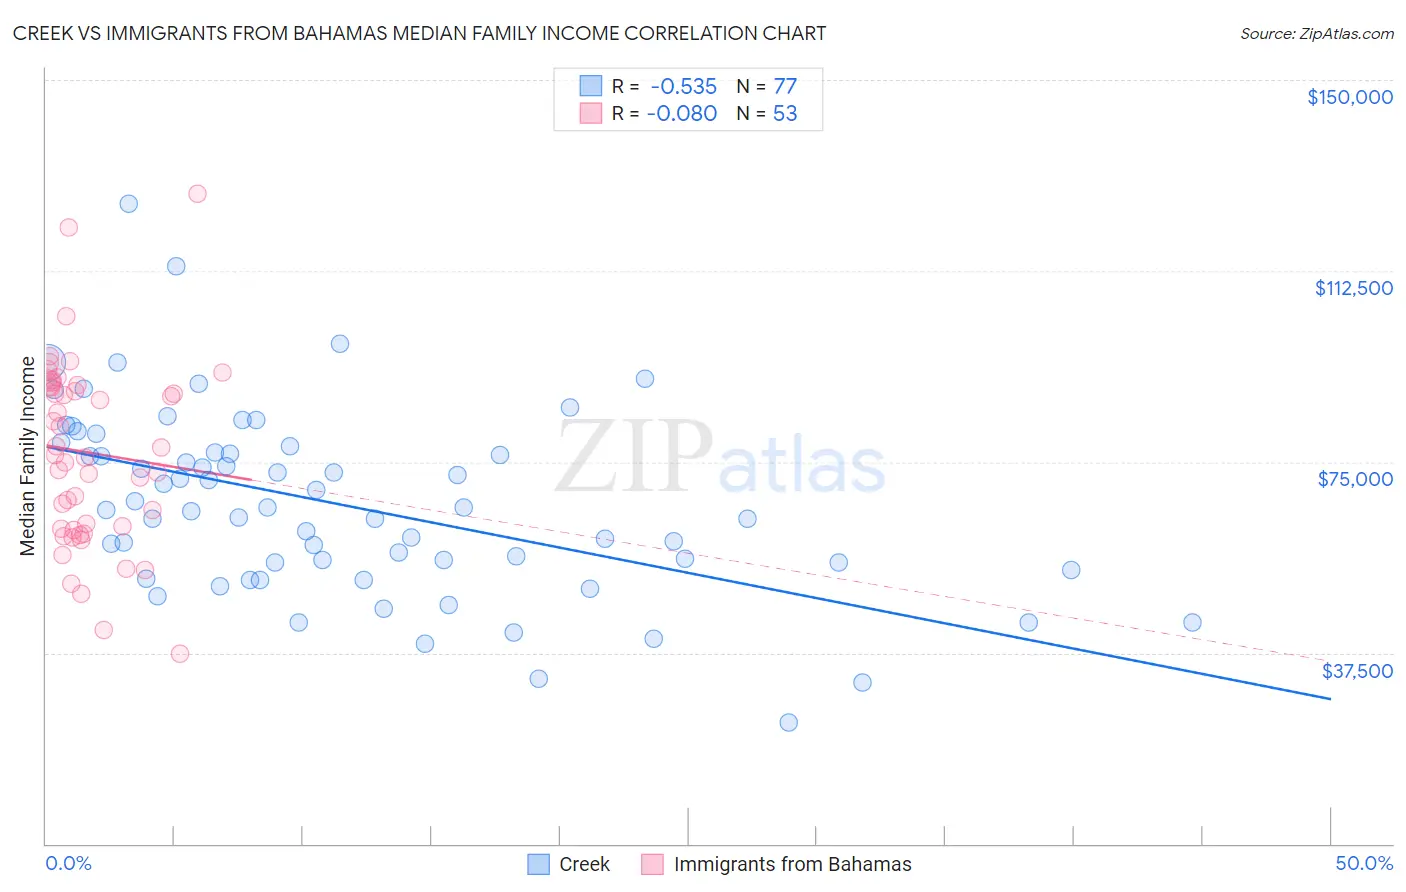
Creek vs Immigrants from Bahamas Median Family Income Correlation Chart

The statistical analysis conducted on geographies consisting of 178,420,625 people shows a substantial negative correlation between the proportion of Creek and median family income in the United States with a correlation coefficient (R) of -0.535 and weighted average of $82,560. Similarly, the statistical analysis conducted on geographies consisting of 104,583,914 people shows a slight negative correlation between the proportion of Immigrants from Bahamas and median family income in the United States with a correlation coefficient (R) of -0.080 and weighted average of $84,732, a difference of 2.6%.
Creek vs Immigrants from Bahamas Median Family Income

Median Family Income Correlation Summary

MeasurementCreekImmigrants from Bahamas
Minimum$23,750$37,231
Maximum$125,671$127,688
Range$101,921$90,457
Mean$66,532$76,834
Median$65,440$76,465
Interquartile 25% (IQ1)$54,458$61,742
Interquartile 75% (IQ3)$77,450$90,302
Interquartile Range (IQR)$22,992$28,560
Standard Deviation (Sample)$18,322$18,260
Standard Deviation (Population)$18,202$18,087

Demographics Similar to Creek and Immigrants from Bahamas by Median Family Income

In terms of median family income, the demographic groups most similar to Creek are Bahamian ($82,631, a difference of 0.090%), Sioux ($82,386, a difference of 0.21%), Dominican ($82,888, a difference of 0.40%), Immigrants from Congo ($82,216, a difference of 0.42%), and Arapaho ($82,064, a difference of 0.61%). Similarly, the demographic groups most similar to Immigrants from Bahamas are Choctaw ($84,835, a difference of 0.12%), Cuban ($84,981, a difference of 0.29%), Honduran ($85,004, a difference of 0.32%), Apache ($84,451, a difference of 0.33%), and Immigrants from Central America ($85,050, a difference of 0.37%).
DemographicsRating | RankMedian Family Income
Haitians
0.0
/100
|
#309
Tragic
$85,218
Immigrants | Central America
0.0
/100
|
#310
Tragic
$85,050
Hondurans
0.0
/100
|
#311
Tragic
$85,004
Cubans
0.0
/100
|
#312
Tragic
$84,981
Choctaw
0.0
/100
|
#313
Tragic
$84,835
Immigrants | Bahamas
0.0
/100
|
#314
Tragic
$84,732
Apache
0.0
/100
|
#315
Tragic
$84,451
Immigrants | Haiti
0.0
/100
|
#316
Tragic
$84,018
Yakama
0.0
/100
|
#317
Tragic
$83,932
Immigrants | Mexico
0.0
/100
|
#318
Tragic
$83,639
Immigrants | Honduras
0.0
/100
|
#319
Tragic
$83,618
Seminole
0.0
/100
|
#320
Tragic
$83,354
Immigrants | Caribbean
0.0
/100
|
#321
Tragic
$83,319
Dominicans
0.0
/100
|
#322
Tragic
$82,888
Bahamians
0.0
/100
|
#323
Tragic
$82,631
Creek
0.0
/100
|
#324
Tragic
$82,560
Sioux
0.0
/100
|
#325
Tragic
$82,386
Immigrants | Congo
0.0
/100
|
#326
Tragic
$82,216
Arapaho
0.0
/100
|
#327
Tragic
$82,064
Blacks/African Americans
0.0
/100
|
#328
Tragic
$81,912
Dutch West Indians
0.0
/100
|
#329
Tragic
$81,852