Zip Codes with the Highest Percentage of Population Employed in Office & Administration in Muncie, IN
RELATED REPORTS & OPTIONS
Office & Administration
Muncie
Compare Zip Codes
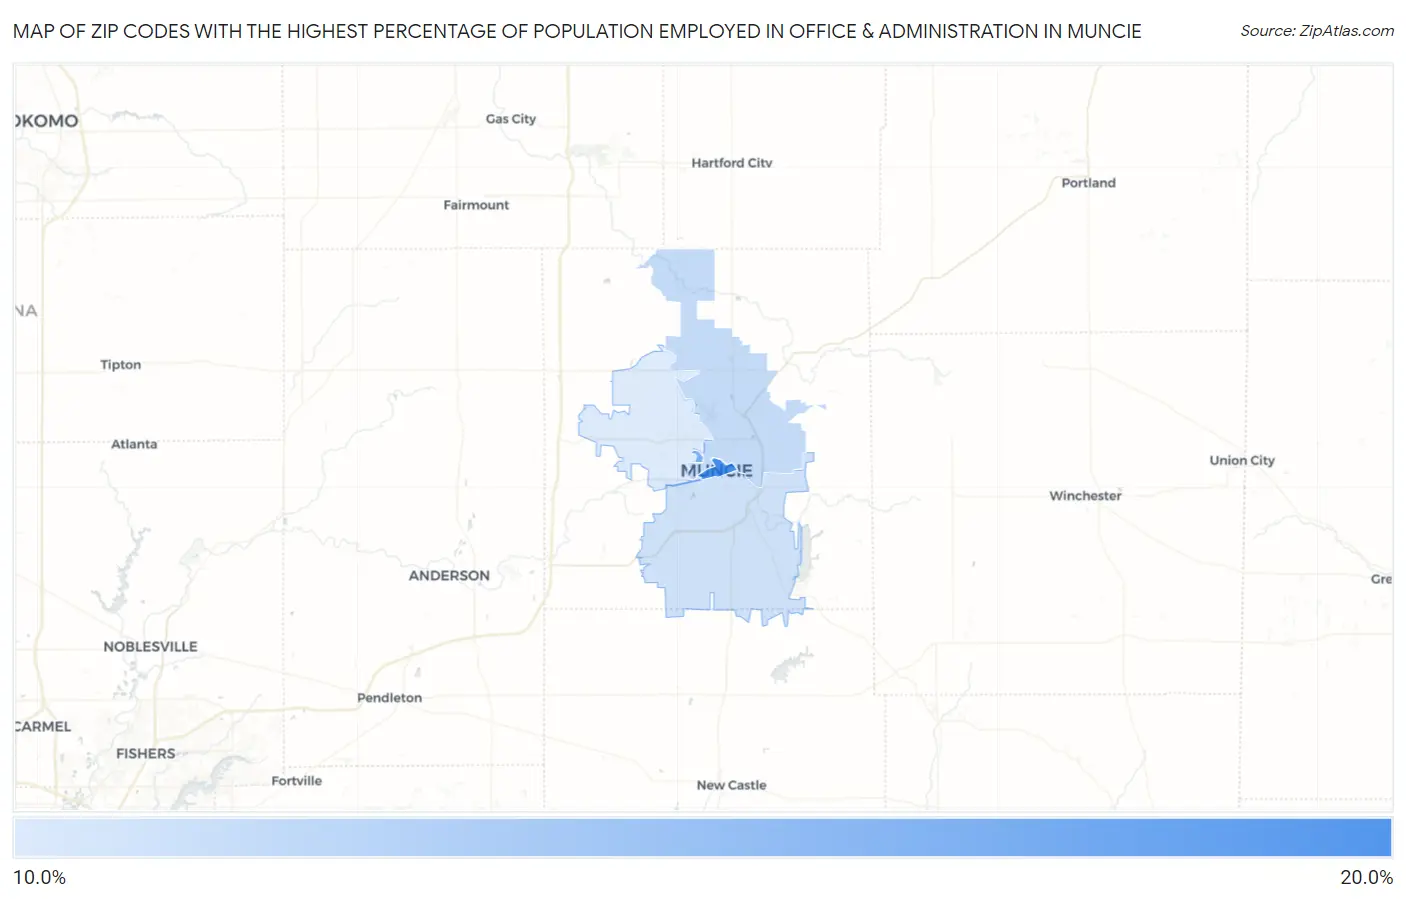
Map of Zip Codes with the Highest Percentage of Population Employed in Office & Administration in Muncie
0.0%
20.0%
Zip Codes with the Highest Percentage of Population Employed in Office & Administration in Muncie, IN
| Zip Code | % Employed | vs State | vs National | |
| 1. | 47305 | 19.3% | 11.0%(+8.33)#28 | 10.9%(+8.47)#1,863 |
| 2. | 47306 | 16.5% | 11.0%(+5.55)#52 | 10.9%(+5.68)#3,143 |
| 3. | 47303 | 12.8% | 11.0%(+1.85)#170 | 10.9%(+1.98)#8,444 |
| 4. | 47302 | 12.2% | 11.0%(+1.26)#202 | 10.9%(+1.39)#9,988 |
| 5. | 47304 | 11.6% | 11.0%(+0.570)#268 | 10.9%(+0.702)#12,084 |
1
Common Questions
What are the Top 3 Zip Codes with the Highest Percentage of Population Employed in Office & Administration in Muncie, IN?
Top 3 Zip Codes with the Highest Percentage of Population Employed in Office & Administration in Muncie, IN are:
What zip code has the Highest Percentage of Population Employed in Office & Administration in Muncie, IN?
47305 has the Highest Percentage of Population Employed in Office & Administration in Muncie, IN with 19.3%.
What is the Percentage of Population Employed in Office & Administration in Muncie, IN?
Percentage of Population Employed in Office & Administration in Muncie is 12.5%.
What is the Percentage of Population Employed in Office & Administration in Indiana?
Percentage of Population Employed in Office & Administration in Indiana is 11.0%.
What is the Percentage of Population Employed in Office & Administration in the United States?
Percentage of Population Employed in Office & Administration in the United States is 10.9%.