Zip Codes with the Highest Percentage of Population Employed in Business & Financial in Muncie, IN
RELATED REPORTS & OPTIONS
Business & Financial
Muncie
Compare Zip Codes
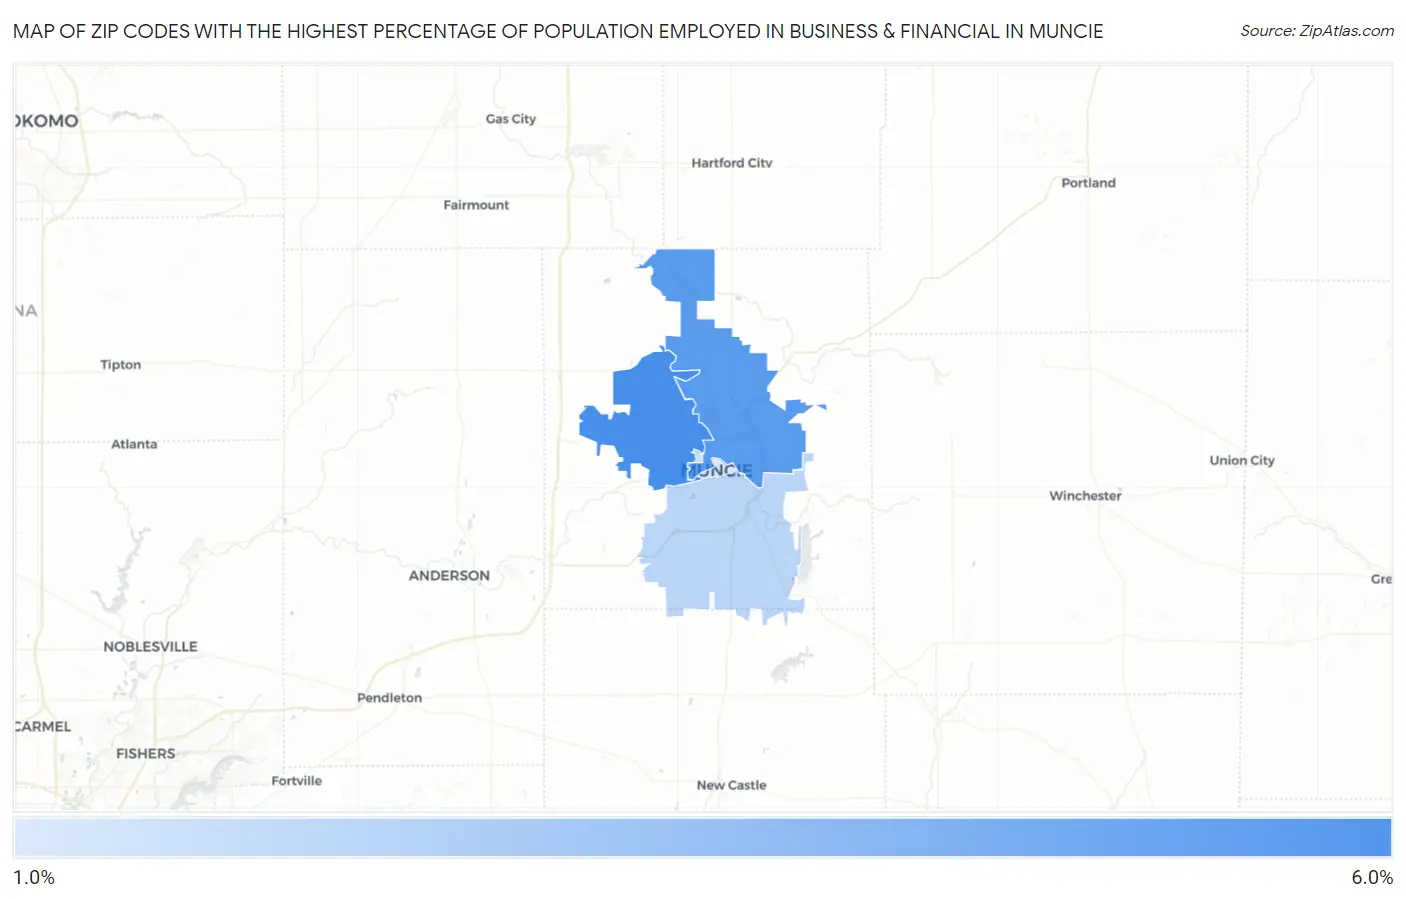
Map of Zip Codes with the Highest Percentage of Population Employed in Business & Financial in Muncie
0.0%
6.0%
Zip Codes with the Highest Percentage of Population Employed in Business & Financial in Muncie, IN
| Zip Code | % Employed | vs State | vs National | |
| 1. | 47304 | 5.2% | 4.8%(+0.454)#173 | 5.8%(-0.531)#9,766 |
| 2. | 47303 | 4.8% | 4.8%(+0.061)#205 | 5.8%(-0.925)#10,941 |
| 3. | 47302 | 2.4% | 4.8%(-2.39)#469 | 5.8%(-3.38)#20,277 |
| 4. | 47306 | 2.0% | 4.8%(-2.78)#513 | 5.8%(-3.76)#21,779 |
| 5. | 47305 | 1.5% | 4.8%(-3.24)#567 | 5.8%(-4.22)#23,402 |
1
Common Questions
What are the Top 3 Zip Codes with the Highest Percentage of Population Employed in Business & Financial in Muncie, IN?
Top 3 Zip Codes with the Highest Percentage of Population Employed in Business & Financial in Muncie, IN are:
What zip code has the Highest Percentage of Population Employed in Business & Financial in Muncie, IN?
47304 has the Highest Percentage of Population Employed in Business & Financial in Muncie, IN with 5.2%.
What is the Percentage of Population Employed in Business & Financial in Muncie, IN?
Percentage of Population Employed in Business & Financial in Muncie is 2.8%.
What is the Percentage of Population Employed in Business & Financial in Indiana?
Percentage of Population Employed in Business & Financial in Indiana is 4.8%.
What is the Percentage of Population Employed in Business & Financial in the United States?
Percentage of Population Employed in Business & Financial in the United States is 5.8%.