Zip Codes with the Highest Percentage of Population Employed in Community & Social Service in Muncie, IN
RELATED REPORTS & OPTIONS
Community & Social Service
Muncie
Compare Zip Codes
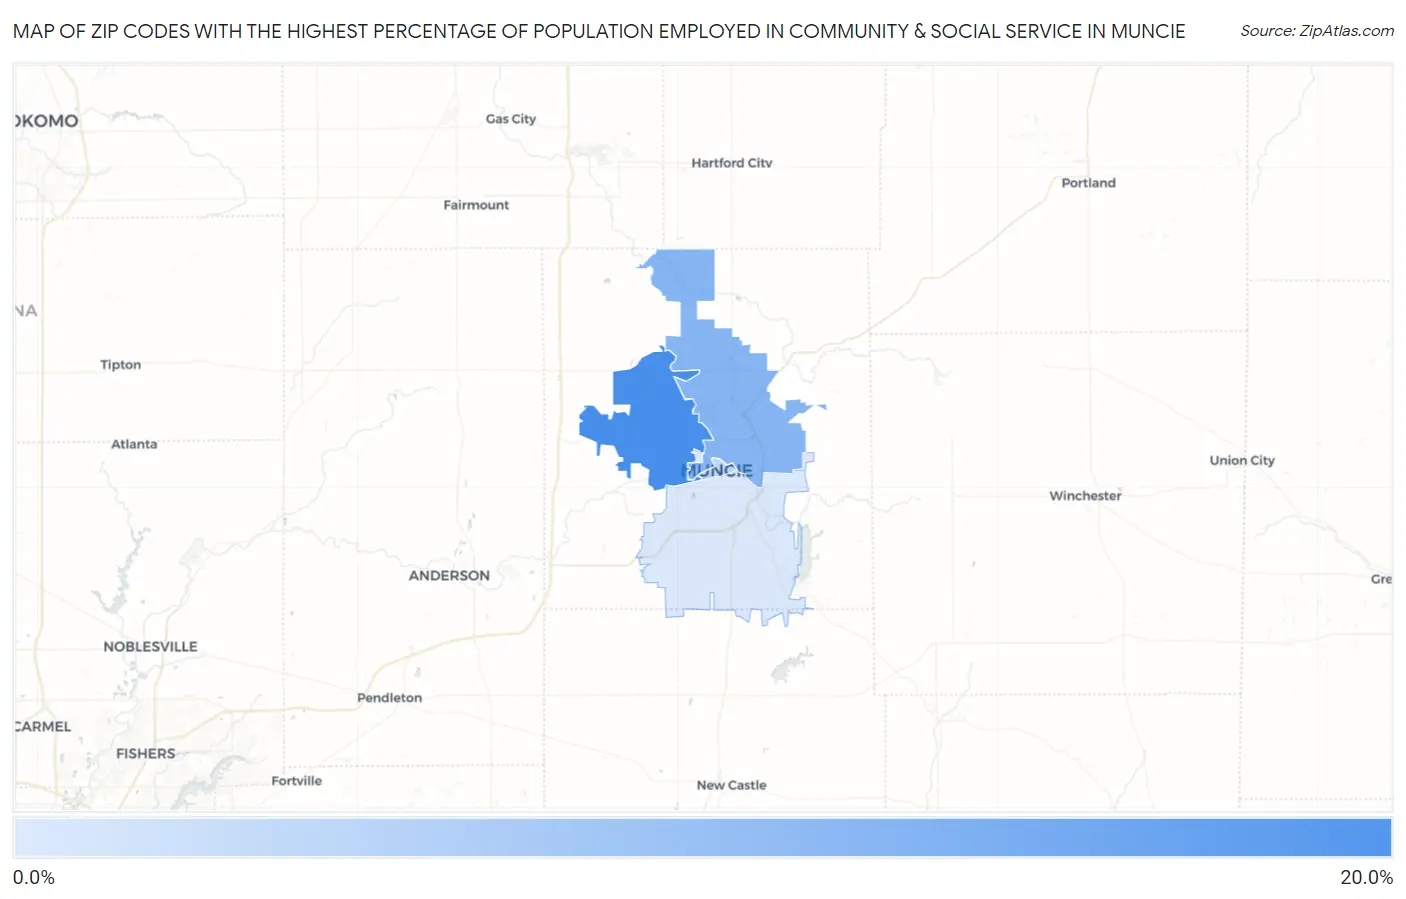
Map of Zip Codes with the Highest Percentage of Population Employed in Community & Social Service in Muncie
0.0%
20.0%
Zip Codes with the Highest Percentage of Population Employed in Community & Social Service in Muncie, IN
| Zip Code | % Employed | vs State | vs National | |
| 1. | 47304 | 16.0% | 9.7%(+6.28)#44 | 11.2%(+4.79)#4,064 |
| 2. | 47303 | 11.7% | 9.7%(+1.93)#134 | 11.2%(+0.440)#10,110 |
| 3. | 47305 | 7.9% | 9.7%(-1.87)#363 | 11.2%(-3.36)#20,011 |
| 4. | 47302 | 5.9% | 9.7%(-3.79)#514 | 11.2%(-5.28)#24,495 |
| 5. | 47306 | 5.8% | 9.7%(-3.88)#522 | 11.2%(-5.37)#24,684 |
1
Common Questions
What are the Top 3 Zip Codes with the Highest Percentage of Population Employed in Community & Social Service in Muncie, IN?
Top 3 Zip Codes with the Highest Percentage of Population Employed in Community & Social Service in Muncie, IN are:
What zip code has the Highest Percentage of Population Employed in Community & Social Service in Muncie, IN?
47304 has the Highest Percentage of Population Employed in Community & Social Service in Muncie, IN with 16.0%.
What is the Percentage of Population Employed in Community & Social Service in Muncie, IN?
Percentage of Population Employed in Community & Social Service in Muncie is 12.6%.
What is the Percentage of Population Employed in Community & Social Service in Indiana?
Percentage of Population Employed in Community & Social Service in Indiana is 9.7%.
What is the Percentage of Population Employed in Community & Social Service in the United States?
Percentage of Population Employed in Community & Social Service in the United States is 11.2%.