Zip Codes with the Highest Percentage of Population Employed in Production in Muncie, IN
RELATED REPORTS & OPTIONS
Production
Muncie
Compare Zip Codes
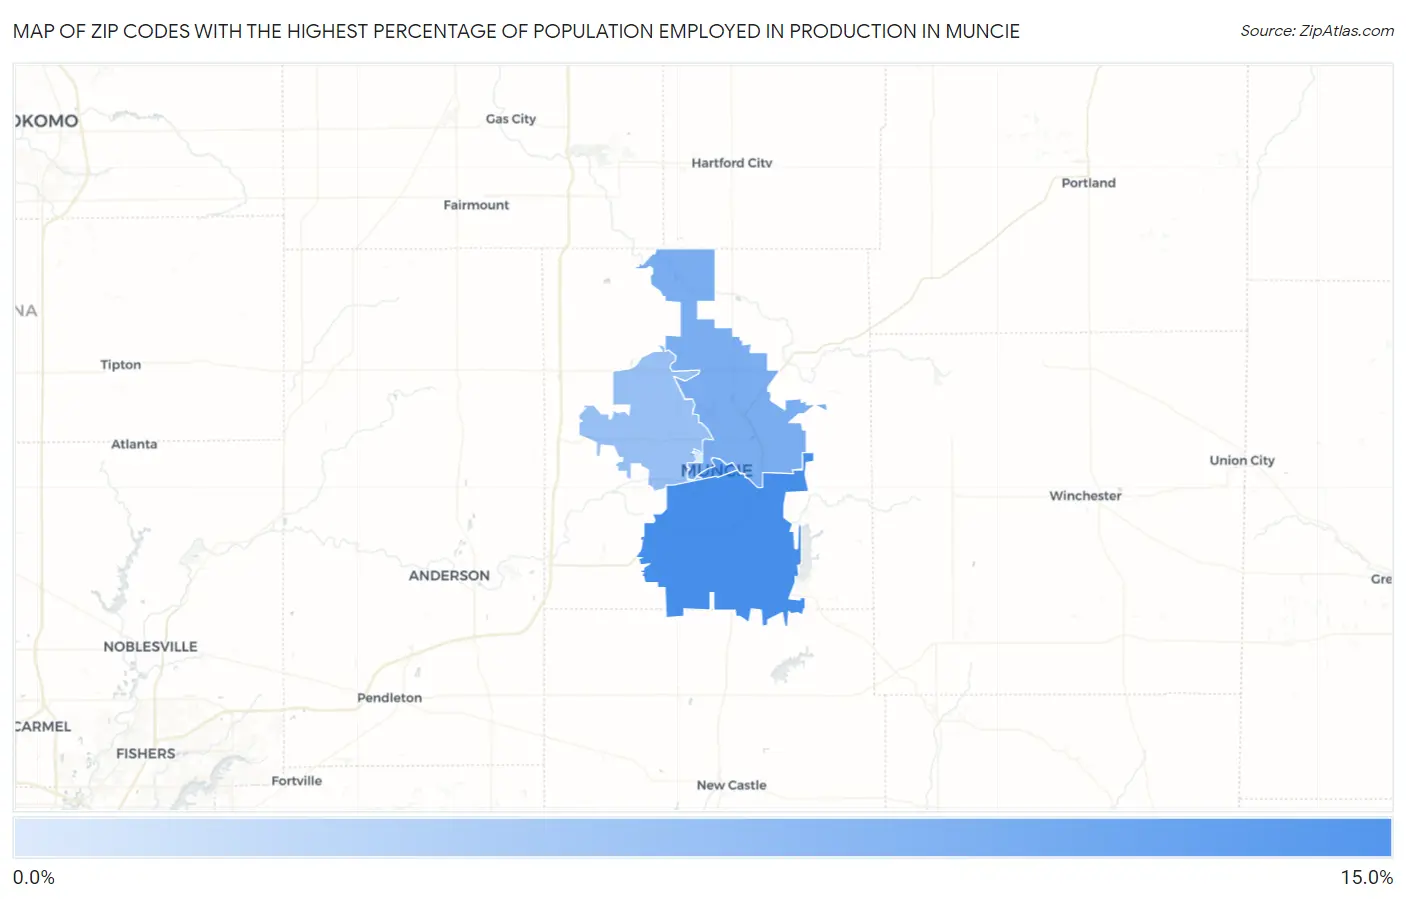
Map of Zip Codes with the Highest Percentage of Population Employed in Production in Muncie
0.0%
15.0%
Zip Codes with the Highest Percentage of Population Employed in Production in Muncie, IN
| Zip Code | % Employed | vs State | vs National | |
| 1. | 47302 | 11.1% | 10.1%(+1.02)#390 | 5.5%(+5.67)#6,384 |
| 2. | 47305 | 9.6% | 10.1%(-0.494)#459 | 5.5%(+4.15)#8,388 |
| 3. | 47303 | 7.6% | 10.1%(-2.50)#554 | 5.5%(+2.15)#11,730 |
| 4. | 47304 | 5.6% | 10.1%(-4.50)#647 | 5.5%(+0.147)#16,162 |
| 5. | 47306 | 1.2% | 10.1%(-8.96)#738 | 5.5%(-4.31)#27,680 |
1
Common Questions
What are the Top 3 Zip Codes with the Highest Percentage of Population Employed in Production in Muncie, IN?
Top 3 Zip Codes with the Highest Percentage of Population Employed in Production in Muncie, IN are:
What zip code has the Highest Percentage of Population Employed in Production in Muncie, IN?
47302 has the Highest Percentage of Population Employed in Production in Muncie, IN with 11.1%.
What is the Percentage of Population Employed in Production in Muncie, IN?
Percentage of Population Employed in Production in Muncie is 7.7%.
What is the Percentage of Population Employed in Production in Indiana?
Percentage of Population Employed in Production in Indiana is 10.1%.
What is the Percentage of Population Employed in Production in the United States?
Percentage of Population Employed in Production in the United States is 5.5%.