Zip Codes with the Highest Percentage of Population Employed in Office & Administration in Marion, IN
RELATED REPORTS & OPTIONS
Office & Administration
Marion
Compare Zip Codes
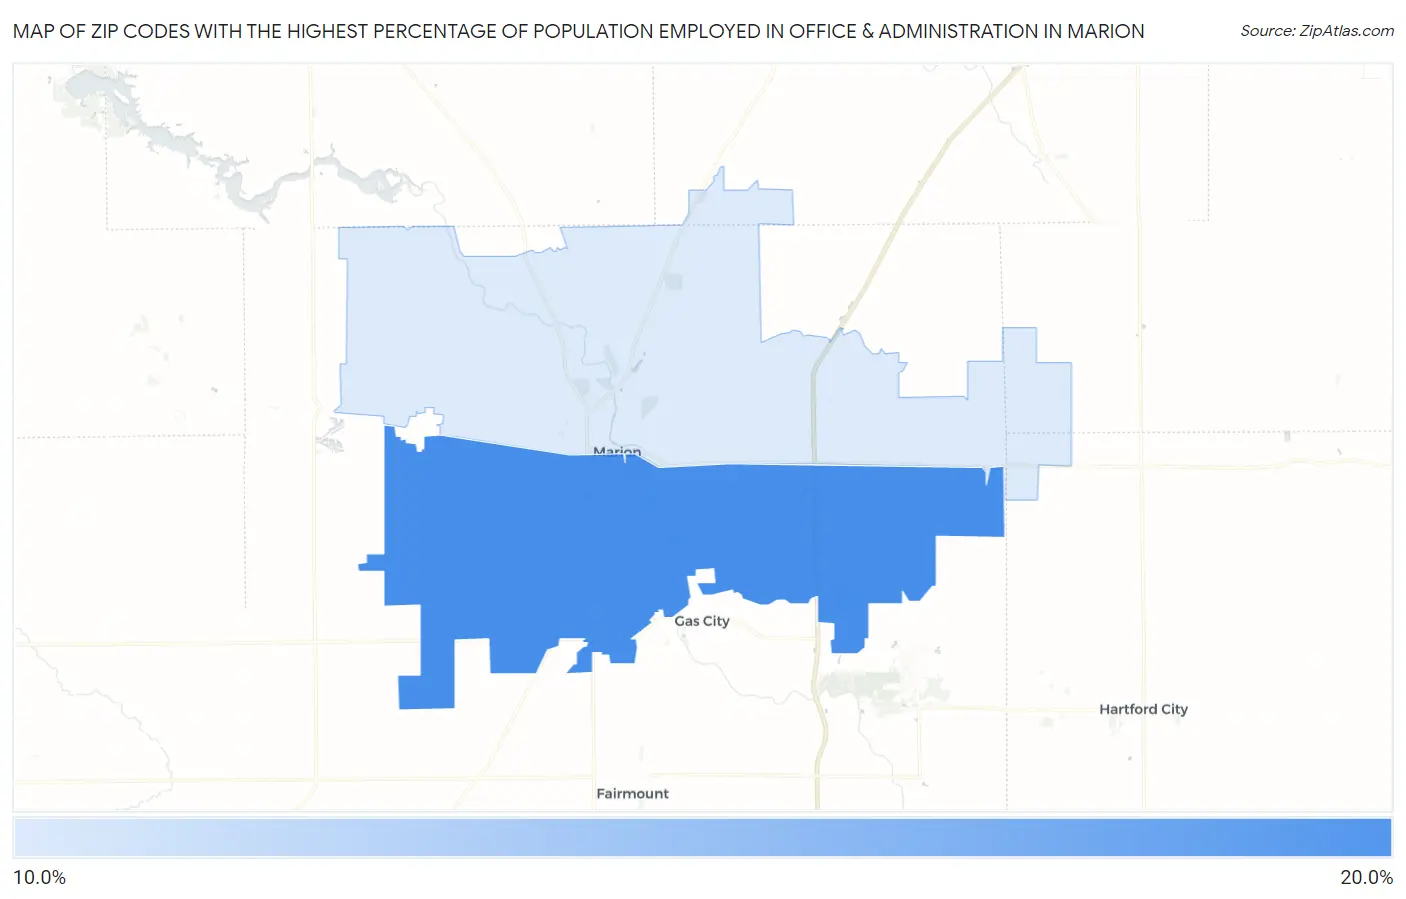
Map of Zip Codes with the Highest Percentage of Population Employed in Office & Administration in Marion
0.0%
20.0%
Zip Codes with the Highest Percentage of Population Employed in Office & Administration in Marion, IN
| Zip Code | % Employed | vs State | vs National | |
| 1. | 46953 | 15.8% | 11.0%(+4.78)#65 | 10.9%(+4.91)#3,765 |
| 2. | 46952 | 14.4% | 11.0%(+3.42)#109 | 10.9%(+3.56)#5,381 |
1
Common Questions
What are the Top Zip Codes with the Highest Percentage of Population Employed in Office & Administration in Marion, IN?
Top Zip Codes with the Highest Percentage of Population Employed in Office & Administration in Marion, IN are:
What zip code has the Highest Percentage of Population Employed in Office & Administration in Marion, IN?
46953 has the Highest Percentage of Population Employed in Office & Administration in Marion, IN with 15.8%.
What is the Percentage of Population Employed in Office & Administration in Marion, IN?
Percentage of Population Employed in Office & Administration in Marion is 29.2%.
What is the Percentage of Population Employed in Office & Administration in Indiana?
Percentage of Population Employed in Office & Administration in Indiana is 11.0%.
What is the Percentage of Population Employed in Office & Administration in the United States?
Percentage of Population Employed in Office & Administration in the United States is 10.9%.