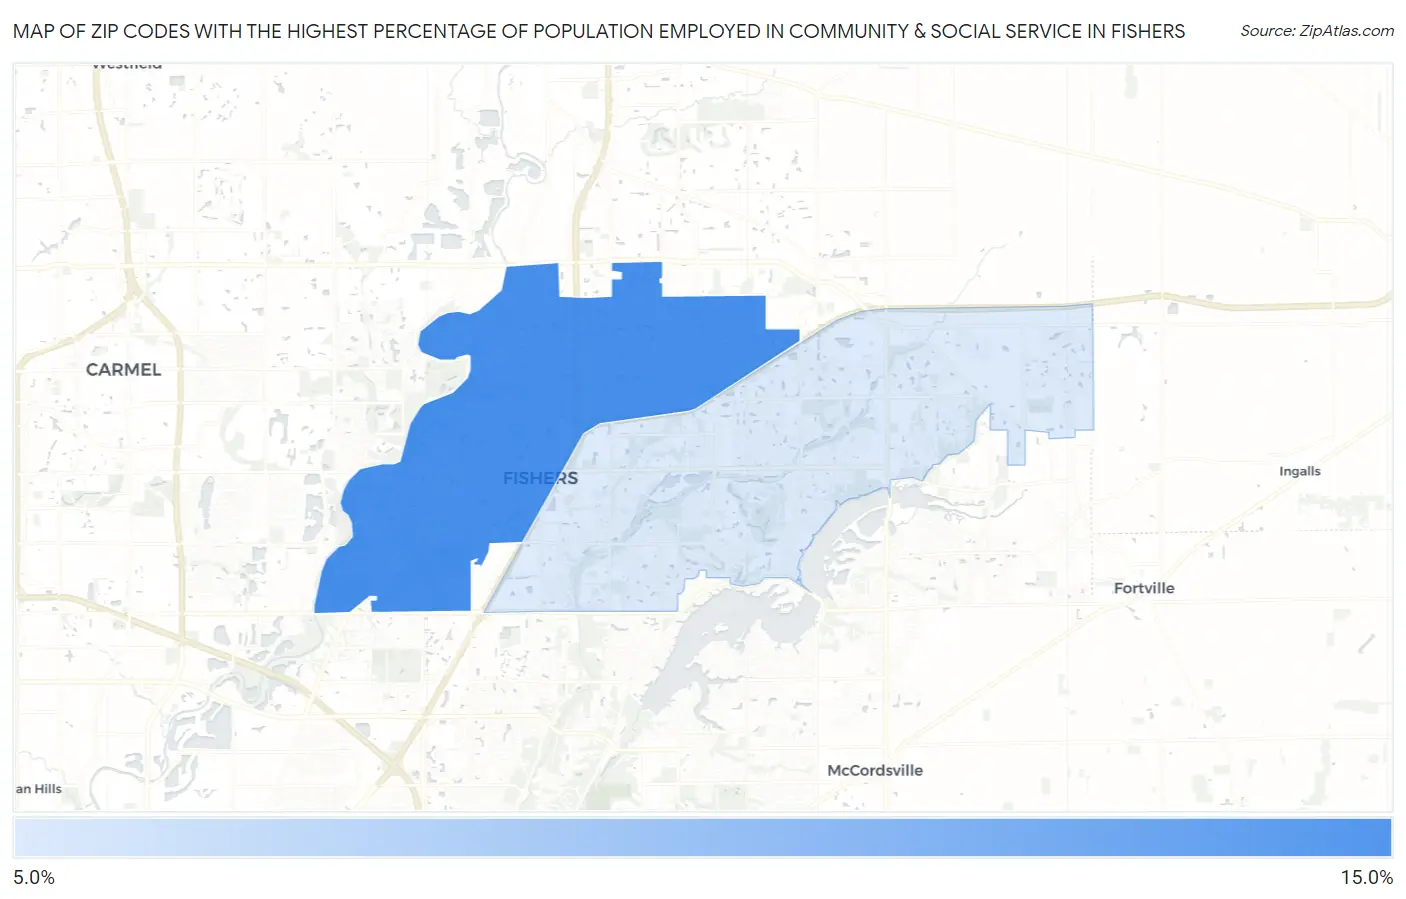
Zip Codes with the Highest Percentage of Population Employed in Community & Social Service in Fishers, IN
RELATED REPORTS & OPTIONS
Community & Social Service
Fishers
Compare Zip Codes
Map of Zip Codes with the Highest Percentage of Population Employed in Community & Social Service in Fishers
0.0%
15.0%
Zip Codes with the Highest Percentage of Population Employed in Community & Social Service in Fishers, IN
| Zip Code | % Employed | vs State | vs National | |
| 1. | 46038 | 13.2% | 9.7%(+3.44)#85 | 11.2%(+1.95)#7,293 |
| 2. | 46037 | 9.5% | 9.7%(-0.265)#247 | 11.2%(-1.75)#15,524 |
1
Common Questions
What are the Top Zip Codes with the Highest Percentage of Population Employed in Community & Social Service in Fishers, IN?
Top Zip Codes with the Highest Percentage of Population Employed in Community & Social Service in Fishers, IN are:
What zip code has the Highest Percentage of Population Employed in Community & Social Service in Fishers, IN?
46038 has the Highest Percentage of Population Employed in Community & Social Service in Fishers, IN with 13.2%.
What is the Percentage of Population Employed in Community & Social Service in Fishers, IN?
Percentage of Population Employed in Community & Social Service in Fishers is 11.1%.
What is the Percentage of Population Employed in Community & Social Service in Indiana?
Percentage of Population Employed in Community & Social Service in Indiana is 9.7%.
What is the Percentage of Population Employed in Community & Social Service in the United States?
Percentage of Population Employed in Community & Social Service in the United States is 11.2%.