Taiwanese vs Iroquois Births to Unmarried Women
COMPARE
Taiwanese
Iroquois
Births to Unmarried Women
Births to Unmarried Women Comparison
Taiwanese
Iroquois
29.0%
BIRTHS TO UNMARRIED WOMEN
97.3/ 100
METRIC RATING
87th/ 347
METRIC RANK
38.2%
BIRTHS TO UNMARRIED WOMEN
0.0/ 100
METRIC RATING
295th/ 347
METRIC RANK
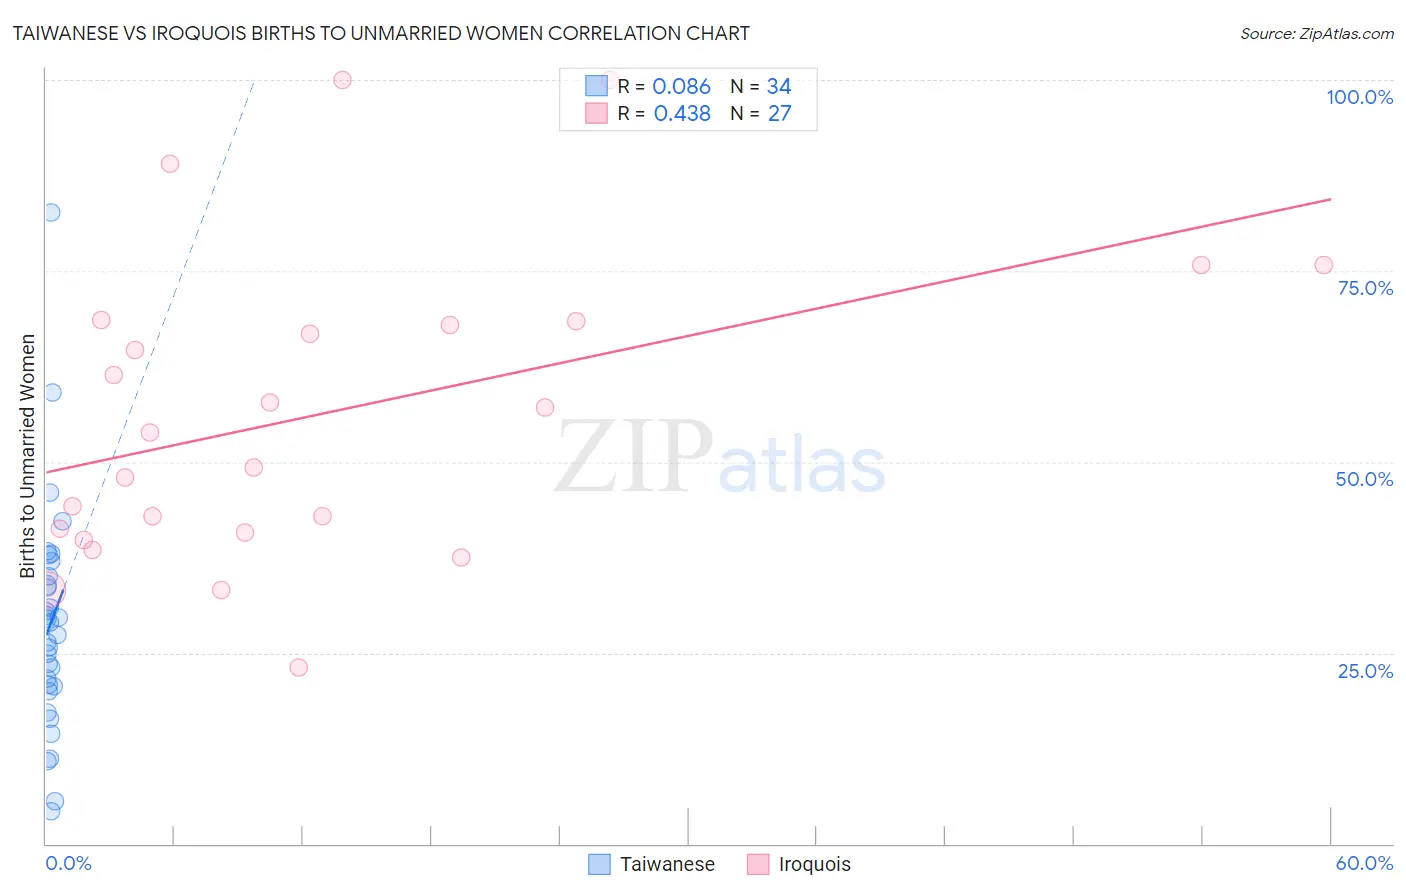
Taiwanese vs Iroquois Births to Unmarried Women Correlation Chart
The statistical analysis conducted on geographies consisting of 31,322,032 people shows a slight positive correlation between the proportion of Taiwanese and percentage of births to unmarried women in the United States with a correlation coefficient (R) of 0.086 and weighted average of 29.0%. Similarly, the statistical analysis conducted on geographies consisting of 199,233,897 people shows a moderate positive correlation between the proportion of Iroquois and percentage of births to unmarried women in the United States with a correlation coefficient (R) of 0.438 and weighted average of 38.2%, a difference of 31.8%.
Births to Unmarried Women Correlation Summary
| Measurement | Taiwanese | Iroquois |
| Minimum | 4.2% | 23.1% |
| Maximum | 82.7% | 100.0% |
| Range | 78.5% | 76.9% |
| Mean | 28.7% | 56.3% |
| Median | 28.1% | 53.8% |
| Interquartile 25% (IQ1) | 20.6% | 40.8% |
| Interquartile 75% (IQ3) | 35.0% | 68.4% |
| Interquartile Range (IQR) | 14.4% | 27.6% |
| Standard Deviation (Sample) | 14.9% | 20.1% |
| Standard Deviation (Population) | 14.7% | 19.7% |
Similar Demographics by Births to Unmarried Women
Demographics Similar to Taiwanese by Births to Unmarried Women
In terms of births to unmarried women, the demographic groups most similar to Taiwanese are Immigrants from France (29.0%, a difference of 0.010%), Immigrants from Jordan (29.0%, a difference of 0.070%), Sri Lankan (28.9%, a difference of 0.15%), Immigrants from Saudi Arabia (29.1%, a difference of 0.28%), and Immigrants from Poland (28.9%, a difference of 0.32%).
| Demographics | Rating | Rank | Births to Unmarried Women |
| Immigrants | Afghanistan | 98.1 /100 | #80 | Exceptional 28.7% |
| Immigrants | Austria | 98.1 /100 | #81 | Exceptional 28.7% |
| Romanians | 98.0 /100 | #82 | Exceptional 28.7% |
| Immigrants | Kuwait | 98.0 /100 | #83 | Exceptional 28.8% |
| Immigrants | Poland | 97.6 /100 | #84 | Exceptional 28.9% |
| Sri Lankans | 97.5 /100 | #85 | Exceptional 28.9% |
| Immigrants | Jordan | 97.4 /100 | #86 | Exceptional 29.0% |
| Taiwanese | 97.3 /100 | #87 | Exceptional 29.0% |
| Immigrants | France | 97.3 /100 | #88 | Exceptional 29.0% |
| Immigrants | Saudi Arabia | 97.0 /100 | #89 | Exceptional 29.1% |
| Immigrants | Latvia | 96.8 /100 | #90 | Exceptional 29.1% |
| Immigrants | Fiji | 96.6 /100 | #91 | Exceptional 29.2% |
| Arabs | 96.5 /100 | #92 | Exceptional 29.2% |
| Estonians | 96.5 /100 | #93 | Exceptional 29.2% |
| Ukrainians | 96.3 /100 | #94 | Exceptional 29.2% |
Demographics Similar to Iroquois by Births to Unmarried Women
In terms of births to unmarried women, the demographic groups most similar to Iroquois are Alaska Native (38.3%, a difference of 0.24%), Dutch West Indian (38.4%, a difference of 0.52%), British West Indian (38.0%, a difference of 0.55%), Immigrants from Nicaragua (38.0%, a difference of 0.60%), and Jamaican (38.5%, a difference of 0.72%).
| Demographics | Rating | Rank | Births to Unmarried Women |
| Immigrants | Liberia | 0.0 /100 | #288 | Tragic 37.6% |
| Alaskan Athabascans | 0.0 /100 | #289 | Tragic 37.7% |
| Hispanics or Latinos | 0.0 /100 | #290 | Tragic 37.8% |
| Seminole | 0.0 /100 | #291 | Tragic 37.9% |
| Blackfeet | 0.0 /100 | #292 | Tragic 37.9% |
| Immigrants | Nicaragua | 0.0 /100 | #293 | Tragic 38.0% |
| British West Indians | 0.0 /100 | #294 | Tragic 38.0% |
| Iroquois | 0.0 /100 | #295 | Tragic 38.2% |
| Alaska Natives | 0.0 /100 | #296 | Tragic 38.3% |
| Dutch West Indians | 0.0 /100 | #297 | Tragic 38.4% |
| Jamaicans | 0.0 /100 | #298 | Tragic 38.5% |
| Spanish Americans | 0.0 /100 | #299 | Tragic 38.6% |
| Immigrants | West Indies | 0.0 /100 | #300 | Tragic 38.6% |
| Haitians | 0.0 /100 | #301 | Tragic 38.6% |
| Hondurans | 0.0 /100 | #302 | Tragic 38.7% |