Taiwanese vs Alsatian Births to Unmarried Women
COMPARE
Taiwanese
Alsatian
Births to Unmarried Women
Births to Unmarried Women Comparison
Taiwanese
Alsatians
29.0%
BIRTHS TO UNMARRIED WOMEN
97.3/ 100
METRIC RATING
87th/ 347
METRIC RANK
33.8%
BIRTHS TO UNMARRIED WOMEN
5.4/ 100
METRIC RATING
219th/ 347
METRIC RANK
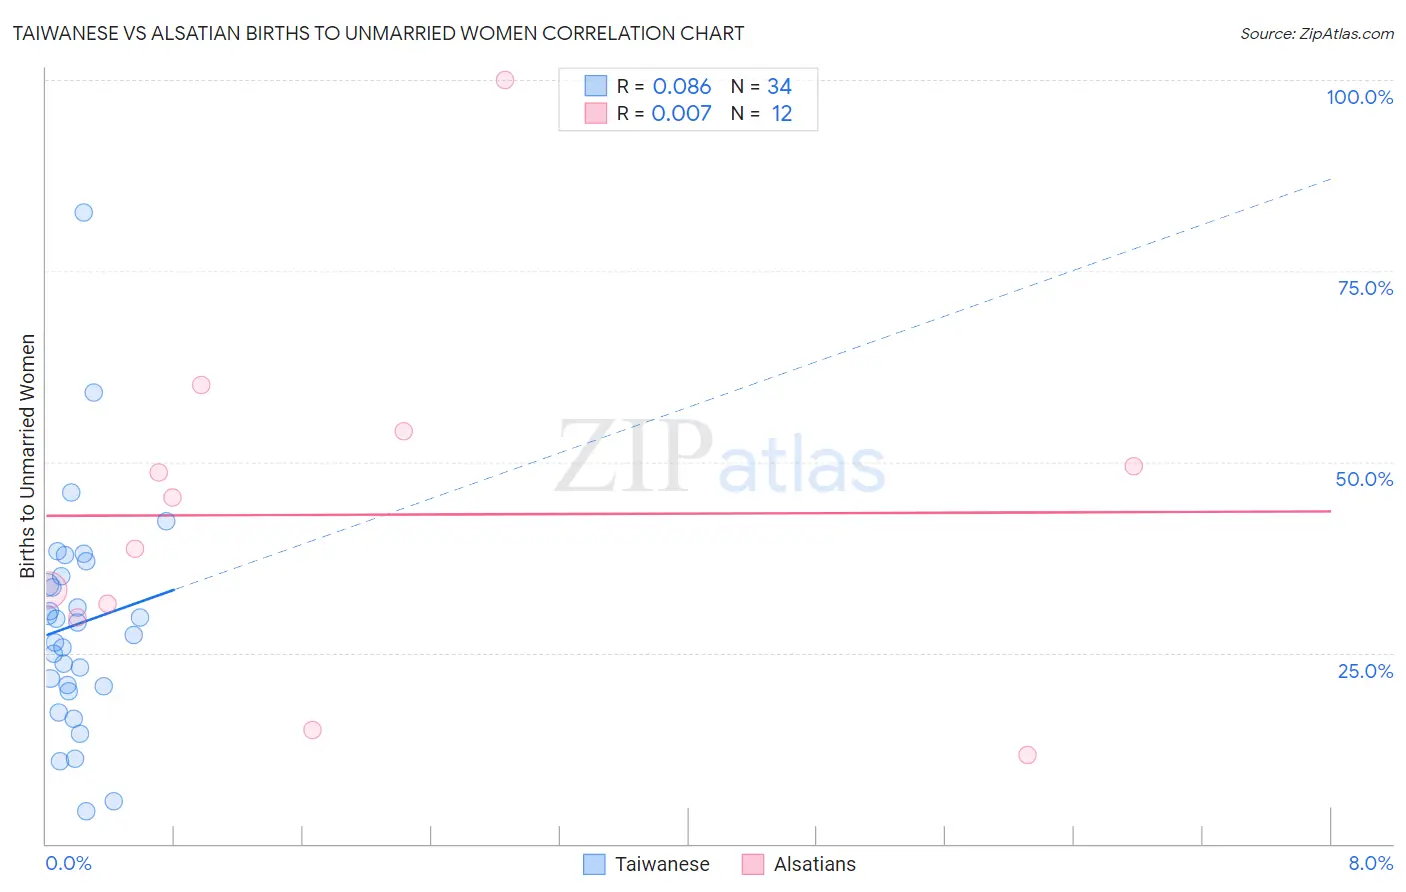
Taiwanese vs Alsatian Births to Unmarried Women Correlation Chart
The statistical analysis conducted on geographies consisting of 31,322,032 people shows a slight positive correlation between the proportion of Taiwanese and percentage of births to unmarried women in the United States with a correlation coefficient (R) of 0.086 and weighted average of 29.0%. Similarly, the statistical analysis conducted on geographies consisting of 80,154,894 people shows no correlation between the proportion of Alsatians and percentage of births to unmarried women in the United States with a correlation coefficient (R) of 0.007 and weighted average of 33.8%, a difference of 16.7%.
Births to Unmarried Women Correlation Summary
| Measurement | Taiwanese | Alsatian |
| Minimum | 4.2% | 11.7% |
| Maximum | 82.7% | 100.0% |
| Range | 78.5% | 88.3% |
| Mean | 28.7% | 43.1% |
| Median | 28.1% | 42.0% |
| Interquartile 25% (IQ1) | 20.6% | 30.5% |
| Interquartile 75% (IQ3) | 35.0% | 51.7% |
| Interquartile Range (IQR) | 14.4% | 21.2% |
| Standard Deviation (Sample) | 14.9% | 23.2% |
| Standard Deviation (Population) | 14.7% | 22.2% |
Similar Demographics by Births to Unmarried Women
Demographics Similar to Taiwanese by Births to Unmarried Women
In terms of births to unmarried women, the demographic groups most similar to Taiwanese are Immigrants from France (29.0%, a difference of 0.010%), Immigrants from Jordan (29.0%, a difference of 0.070%), Sri Lankan (28.9%, a difference of 0.15%), Immigrants from Saudi Arabia (29.1%, a difference of 0.28%), and Immigrants from Poland (28.9%, a difference of 0.32%).
| Demographics | Rating | Rank | Births to Unmarried Women |
| Immigrants | Afghanistan | 98.1 /100 | #80 | Exceptional 28.7% |
| Immigrants | Austria | 98.1 /100 | #81 | Exceptional 28.7% |
| Romanians | 98.0 /100 | #82 | Exceptional 28.7% |
| Immigrants | Kuwait | 98.0 /100 | #83 | Exceptional 28.8% |
| Immigrants | Poland | 97.6 /100 | #84 | Exceptional 28.9% |
| Sri Lankans | 97.5 /100 | #85 | Exceptional 28.9% |
| Immigrants | Jordan | 97.4 /100 | #86 | Exceptional 29.0% |
| Taiwanese | 97.3 /100 | #87 | Exceptional 29.0% |
| Immigrants | France | 97.3 /100 | #88 | Exceptional 29.0% |
| Immigrants | Saudi Arabia | 97.0 /100 | #89 | Exceptional 29.1% |
| Immigrants | Latvia | 96.8 /100 | #90 | Exceptional 29.1% |
| Immigrants | Fiji | 96.6 /100 | #91 | Exceptional 29.2% |
| Arabs | 96.5 /100 | #92 | Exceptional 29.2% |
| Estonians | 96.5 /100 | #93 | Exceptional 29.2% |
| Ukrainians | 96.3 /100 | #94 | Exceptional 29.2% |
Demographics Similar to Alsatians by Births to Unmarried Women
In terms of births to unmarried women, the demographic groups most similar to Alsatians are Portuguese (33.8%, a difference of 0.020%), Malaysian (33.9%, a difference of 0.19%), Immigrants from Ecuador (33.7%, a difference of 0.22%), Immigrants from Uruguay (33.9%, a difference of 0.26%), and Pennsylvania German (34.0%, a difference of 0.55%).
| Demographics | Rating | Rank | Births to Unmarried Women |
| Celtics | 10.2 /100 | #212 | Poor 33.3% |
| Immigrants | Costa Rica | 9.5 /100 | #213 | Tragic 33.4% |
| Slovaks | 9.3 /100 | #214 | Tragic 33.4% |
| French | 8.7 /100 | #215 | Tragic 33.4% |
| Nepalese | 7.8 /100 | #216 | Tragic 33.5% |
| Spaniards | 7.0 /100 | #217 | Tragic 33.6% |
| Immigrants | Ecuador | 5.9 /100 | #218 | Tragic 33.7% |
| Alsatians | 5.4 /100 | #219 | Tragic 33.8% |
| Portuguese | 5.4 /100 | #220 | Tragic 33.8% |
| Malaysians | 5.0 /100 | #221 | Tragic 33.9% |
| Immigrants | Uruguay | 4.8 /100 | #222 | Tragic 33.9% |
| Pennsylvania Germans | 4.3 /100 | #223 | Tragic 34.0% |
| Immigrants | Laos | 4.3 /100 | #224 | Tragic 34.0% |
| Spanish | 4.0 /100 | #225 | Tragic 34.1% |
| Delaware | 3.3 /100 | #226 | Tragic 34.2% |