Malaysian vs Immigrants from Costa Rica Single Father Households
COMPARE
Malaysian
Immigrants from Costa Rica
Single Father Households
Single Father Households Comparison
Malaysians
Immigrants from Costa Rica
2.7%
SINGLE FATHER HOUSEHOLDS
0.0/ 100
METRIC RATING
294th/ 347
METRIC RANK
2.4%
SINGLE FATHER HOUSEHOLDS
19.2/ 100
METRIC RATING
210th/ 347
METRIC RANK
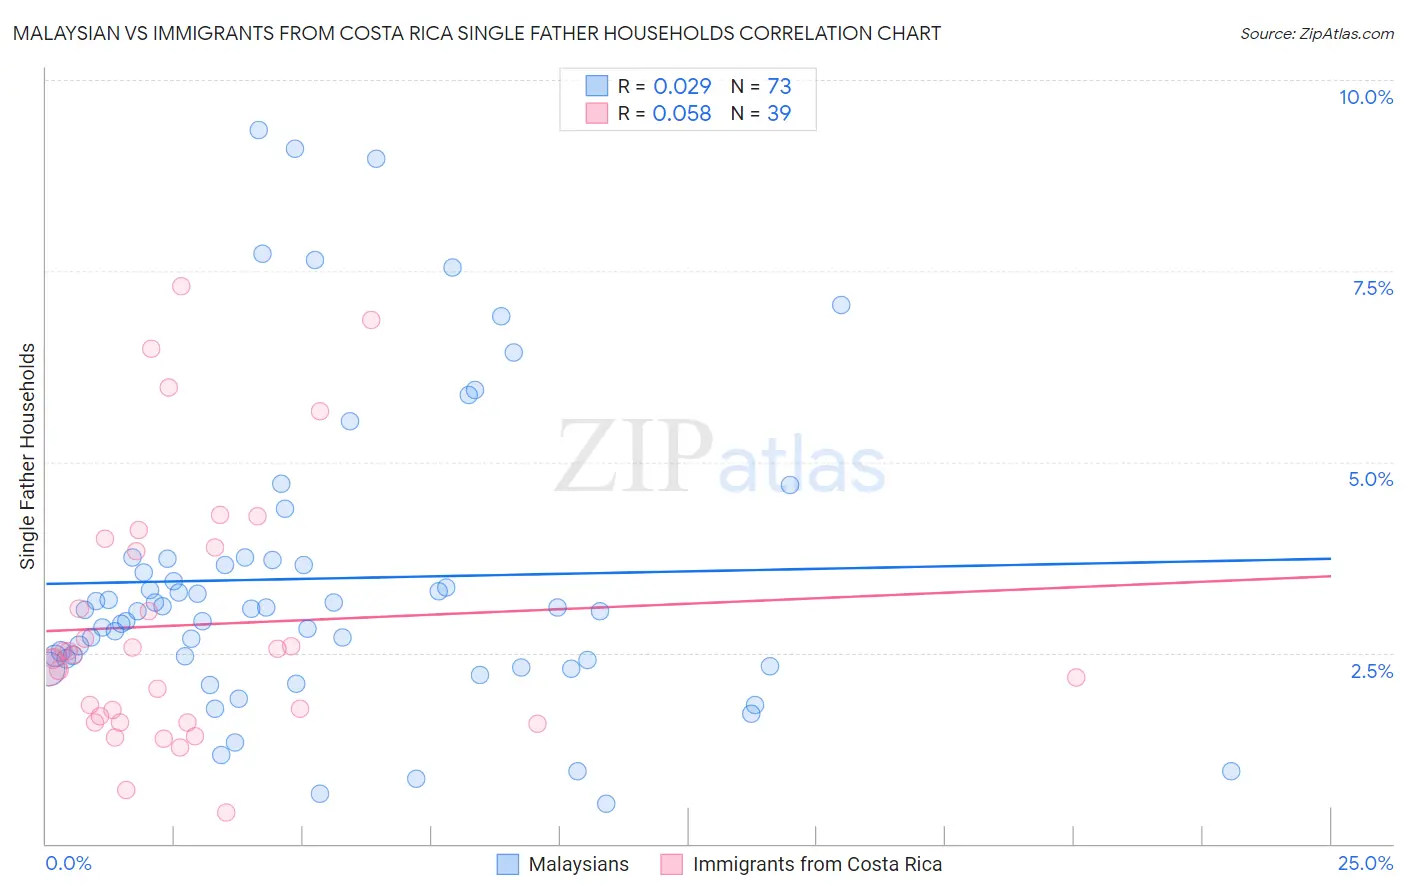
Malaysian vs Immigrants from Costa Rica Single Father Households Correlation Chart
The statistical analysis conducted on geographies consisting of 225,437,553 people shows no correlation between the proportion of Malaysians and percentage of single father households in the United States with a correlation coefficient (R) of 0.029 and weighted average of 2.7%. Similarly, the statistical analysis conducted on geographies consisting of 203,697,810 people shows a slight positive correlation between the proportion of Immigrants from Costa Rica and percentage of single father households in the United States with a correlation coefficient (R) of 0.058 and weighted average of 2.4%, a difference of 13.8%.
Single Father Households Correlation Summary
| Measurement | Malaysian | Immigrants from Costa Rica |
| Minimum | 0.53% | 0.40% |
| Maximum | 9.3% | 7.3% |
| Range | 8.8% | 6.9% |
| Mean | 3.5% | 2.9% |
| Median | 3.1% | 2.5% |
| Interquartile 25% (IQ1) | 2.4% | 1.6% |
| Interquartile 75% (IQ3) | 3.7% | 3.9% |
| Interquartile Range (IQR) | 1.4% | 2.3% |
| Standard Deviation (Sample) | 2.0% | 1.7% |
| Standard Deviation (Population) | 2.0% | 1.7% |
Similar Demographics by Single Father Households
Demographics Similar to Malaysians by Single Father Households
In terms of single father households, the demographic groups most similar to Malaysians are Immigrants from Fiji (2.7%, a difference of 0.43%), Choctaw (2.7%, a difference of 0.59%), Chickasaw (2.8%, a difference of 0.80%), Japanese (2.8%, a difference of 0.83%), and Honduran (2.8%, a difference of 0.91%).
| Demographics | Rating | Rank | Single Father Households |
| Central American Indians | 0.0 /100 | #287 | Tragic 2.7% |
| Immigrants | Cambodia | 0.0 /100 | #288 | Tragic 2.7% |
| Tlingit-Haida | 0.0 /100 | #289 | Tragic 2.7% |
| Puget Sound Salish | 0.0 /100 | #290 | Tragic 2.7% |
| Blackfeet | 0.0 /100 | #291 | Tragic 2.7% |
| Choctaw | 0.0 /100 | #292 | Tragic 2.7% |
| Immigrants | Fiji | 0.0 /100 | #293 | Tragic 2.7% |
| Malaysians | 0.0 /100 | #294 | Tragic 2.7% |
| Chickasaw | 0.0 /100 | #295 | Tragic 2.8% |
| Japanese | 0.0 /100 | #296 | Tragic 2.8% |
| Hondurans | 0.0 /100 | #297 | Tragic 2.8% |
| Cree | 0.0 /100 | #298 | Tragic 2.8% |
| Lumbee | 0.0 /100 | #299 | Tragic 2.8% |
| Kiowa | 0.0 /100 | #300 | Tragic 2.8% |
| Immigrants | Latin America | 0.0 /100 | #301 | Tragic 2.8% |
Demographics Similar to Immigrants from Costa Rica by Single Father Households
In terms of single father households, the demographic groups most similar to Immigrants from Costa Rica are Immigrants from Peru (2.4%, a difference of 0.010%), Immigrants from Nigeria (2.4%, a difference of 0.050%), Finnish (2.4%, a difference of 0.10%), Immigrants from Kenya (2.4%, a difference of 0.13%), and Norwegian (2.4%, a difference of 0.25%).
| Demographics | Rating | Rank | Single Father Households |
| French Canadians | 24.7 /100 | #203 | Fair 2.4% |
| Ecuadorians | 24.5 /100 | #204 | Fair 2.4% |
| Immigrants | Afghanistan | 24.2 /100 | #205 | Fair 2.4% |
| Koreans | 24.1 /100 | #206 | Fair 2.4% |
| Whites/Caucasians | 22.6 /100 | #207 | Fair 2.4% |
| Immigrants | Kenya | 20.3 /100 | #208 | Fair 2.4% |
| Immigrants | Peru | 19.3 /100 | #209 | Poor 2.4% |
| Immigrants | Costa Rica | 19.2 /100 | #210 | Poor 2.4% |
| Immigrants | Nigeria | 18.7 /100 | #211 | Poor 2.4% |
| Finns | 18.3 /100 | #212 | Poor 2.4% |
| Norwegians | 17.1 /100 | #213 | Poor 2.4% |
| Ethiopians | 16.6 /100 | #214 | Poor 2.4% |
| Immigrants | South Eastern Asia | 15.9 /100 | #215 | Poor 2.4% |
| Immigrants | Ecuador | 14.9 /100 | #216 | Poor 2.4% |
| Dutch | 14.3 /100 | #217 | Poor 2.4% |