Malaysian vs Austrian Single Father Households
COMPARE
Malaysian
Austrian
Single Father Households
Single Father Households Comparison
Malaysians
Austrians
2.7%
SINGLE FATHER HOUSEHOLDS
0.0/ 100
METRIC RATING
294th/ 347
METRIC RANK
2.2%
SINGLE FATHER HOUSEHOLDS
94.2/ 100
METRIC RATING
137th/ 347
METRIC RANK
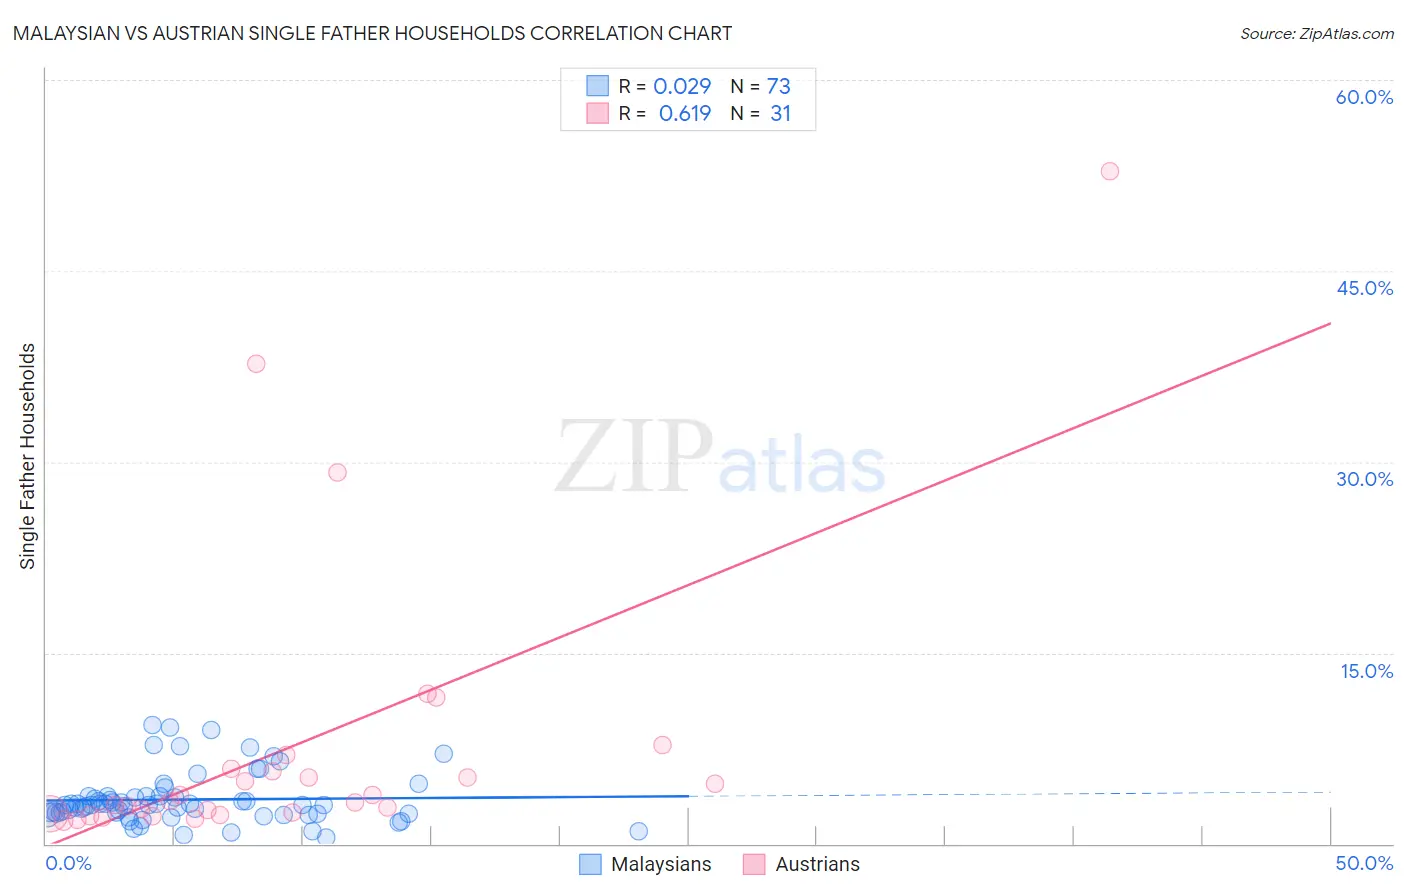
Malaysian vs Austrian Single Father Households Correlation Chart
The statistical analysis conducted on geographies consisting of 225,437,553 people shows no correlation between the proportion of Malaysians and percentage of single father households in the United States with a correlation coefficient (R) of 0.029 and weighted average of 2.7%. Similarly, the statistical analysis conducted on geographies consisting of 445,997,732 people shows a significant positive correlation between the proportion of Austrians and percentage of single father households in the United States with a correlation coefficient (R) of 0.619 and weighted average of 2.2%, a difference of 23.1%.
Single Father Households Correlation Summary
| Measurement | Malaysian | Austrian |
| Minimum | 0.53% | 1.8% |
| Maximum | 9.3% | 52.8% |
| Range | 8.8% | 51.0% |
| Mean | 3.5% | 7.7% |
| Median | 3.1% | 3.4% |
| Interquartile 25% (IQ1) | 2.4% | 2.3% |
| Interquartile 75% (IQ3) | 3.7% | 5.9% |
| Interquartile Range (IQR) | 1.4% | 3.6% |
| Standard Deviation (Sample) | 2.0% | 11.4% |
| Standard Deviation (Population) | 2.0% | 11.3% |
Similar Demographics by Single Father Households
Demographics Similar to Malaysians by Single Father Households
In terms of single father households, the demographic groups most similar to Malaysians are Immigrants from Fiji (2.7%, a difference of 0.43%), Choctaw (2.7%, a difference of 0.59%), Chickasaw (2.8%, a difference of 0.80%), Japanese (2.8%, a difference of 0.83%), and Honduran (2.8%, a difference of 0.91%).
| Demographics | Rating | Rank | Single Father Households |
| Central American Indians | 0.0 /100 | #287 | Tragic 2.7% |
| Immigrants | Cambodia | 0.0 /100 | #288 | Tragic 2.7% |
| Tlingit-Haida | 0.0 /100 | #289 | Tragic 2.7% |
| Puget Sound Salish | 0.0 /100 | #290 | Tragic 2.7% |
| Blackfeet | 0.0 /100 | #291 | Tragic 2.7% |
| Choctaw | 0.0 /100 | #292 | Tragic 2.7% |
| Immigrants | Fiji | 0.0 /100 | #293 | Tragic 2.7% |
| Malaysians | 0.0 /100 | #294 | Tragic 2.7% |
| Chickasaw | 0.0 /100 | #295 | Tragic 2.8% |
| Japanese | 0.0 /100 | #296 | Tragic 2.8% |
| Hondurans | 0.0 /100 | #297 | Tragic 2.8% |
| Cree | 0.0 /100 | #298 | Tragic 2.8% |
| Lumbee | 0.0 /100 | #299 | Tragic 2.8% |
| Kiowa | 0.0 /100 | #300 | Tragic 2.8% |
| Immigrants | Latin America | 0.0 /100 | #301 | Tragic 2.8% |
Demographics Similar to Austrians by Single Father Households
In terms of single father households, the demographic groups most similar to Austrians are West Indian (2.2%, a difference of 0.030%), Chilean (2.2%, a difference of 0.11%), Syrian (2.2%, a difference of 0.23%), Zimbabwean (2.2%, a difference of 0.34%), and Brazilian (2.2%, a difference of 0.45%).
| Demographics | Rating | Rank | Single Father Households |
| Immigrants | Chile | 96.7 /100 | #130 | Exceptional 2.2% |
| Immigrants | Jordan | 96.6 /100 | #131 | Exceptional 2.2% |
| Poles | 96.5 /100 | #132 | Exceptional 2.2% |
| Taiwanese | 96.3 /100 | #133 | Exceptional 2.2% |
| Zimbabweans | 95.1 /100 | #134 | Exceptional 2.2% |
| Syrians | 94.8 /100 | #135 | Exceptional 2.2% |
| Chileans | 94.5 /100 | #136 | Exceptional 2.2% |
| Austrians | 94.2 /100 | #137 | Exceptional 2.2% |
| West Indians | 94.1 /100 | #138 | Exceptional 2.2% |
| Brazilians | 92.8 /100 | #139 | Exceptional 2.2% |
| British | 92.8 /100 | #140 | Exceptional 2.2% |
| Laotians | 92.5 /100 | #141 | Exceptional 2.2% |
| Luxembourgers | 92.3 /100 | #142 | Exceptional 2.2% |
| Immigrants | Nepal | 92.1 /100 | #143 | Exceptional 2.2% |
| Slovaks | 90.7 /100 | #144 | Exceptional 2.2% |