Indian (Asian) vs Immigrants from Fiji Single Father Households
COMPARE
Indian (Asian)
Immigrants from Fiji
Single Father Households
Single Father Households Comparison
Indians (Asian)
Immigrants from Fiji
1.9%
SINGLE FATHER HOUSEHOLDS
100.0/ 100
METRIC RATING
18th/ 347
METRIC RANK
2.7%
SINGLE FATHER HOUSEHOLDS
0.0/ 100
METRIC RATING
293rd/ 347
METRIC RANK
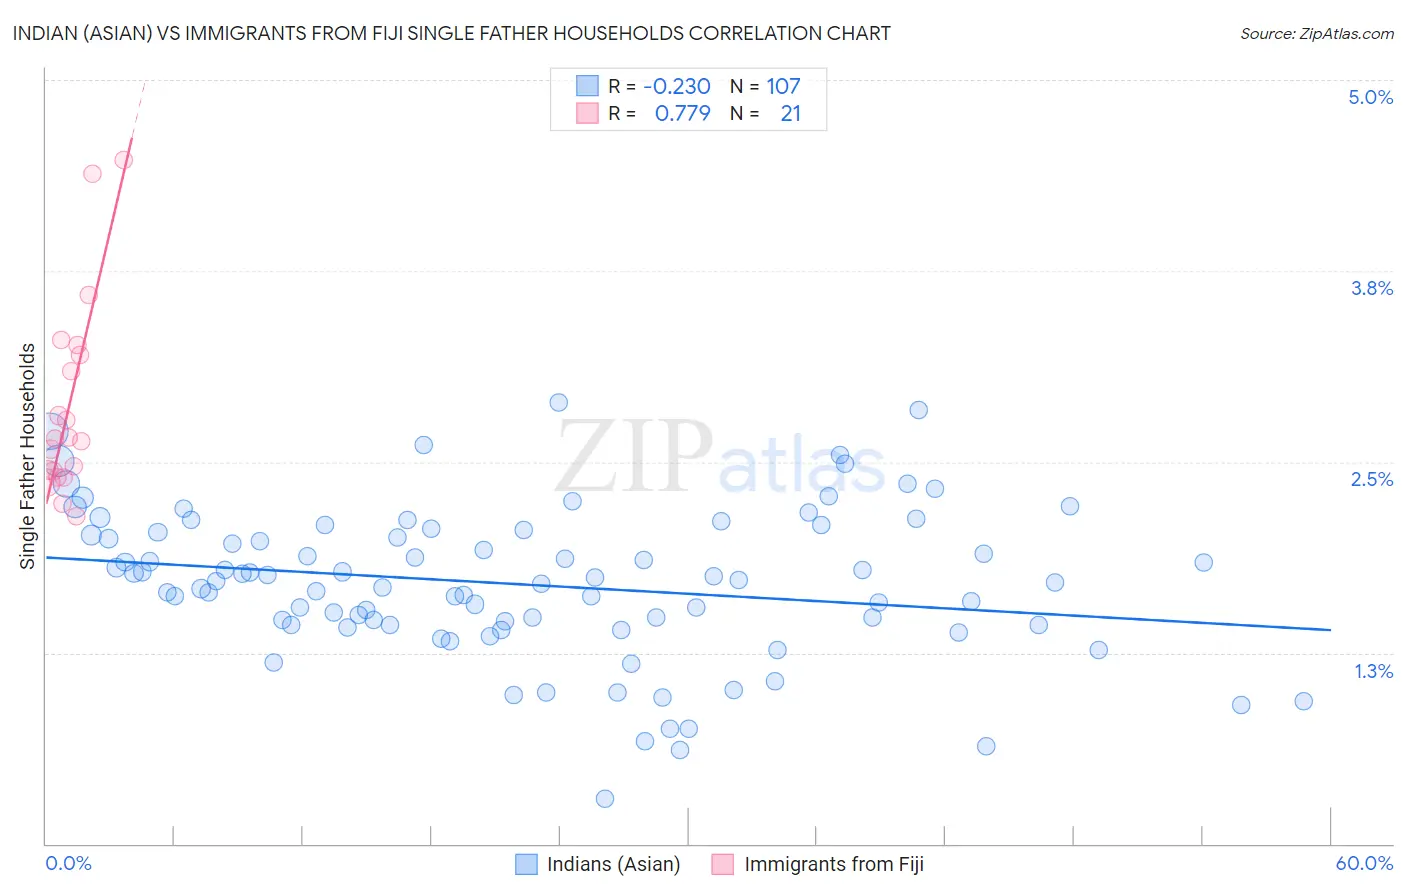
Indian (Asian) vs Immigrants from Fiji Single Father Households Correlation Chart
The statistical analysis conducted on geographies consisting of 488,421,643 people shows a weak negative correlation between the proportion of Indians (Asian) and percentage of single father households in the United States with a correlation coefficient (R) of -0.230 and weighted average of 1.9%. Similarly, the statistical analysis conducted on geographies consisting of 93,616,841 people shows a strong positive correlation between the proportion of Immigrants from Fiji and percentage of single father households in the United States with a correlation coefficient (R) of 0.779 and weighted average of 2.7%, a difference of 42.6%.
Single Father Households Correlation Summary
| Measurement | Indian (Asian) | Immigrants from Fiji |
| Minimum | 0.29% | 2.1% |
| Maximum | 2.9% | 4.5% |
| Range | 2.6% | 2.3% |
| Mean | 1.7% | 2.9% |
| Median | 1.7% | 2.6% |
| Interquartile 25% (IQ1) | 1.4% | 2.4% |
| Interquartile 75% (IQ3) | 2.0% | 3.2% |
| Interquartile Range (IQR) | 0.61% | 0.81% |
| Standard Deviation (Sample) | 0.49% | 0.64% |
| Standard Deviation (Population) | 0.49% | 0.63% |
Similar Demographics by Single Father Households
Demographics Similar to Indians (Asian) by Single Father Households
In terms of single father households, the demographic groups most similar to Indians (Asian) are Immigrants from India (1.9%, a difference of 0.50%), Immigrants from Iran (1.9%, a difference of 0.72%), Iranian (1.9%, a difference of 0.84%), Thai (1.9%, a difference of 0.91%), and Immigrants from Eastern Asia (1.9%, a difference of 0.93%).
| Demographics | Rating | Rank | Single Father Households |
| Immigrants | Belarus | 100.0 /100 | #11 | Exceptional 1.9% |
| Immigrants | Greece | 100.0 /100 | #12 | Exceptional 1.9% |
| Immigrants | Singapore | 100.0 /100 | #13 | Exceptional 1.9% |
| Immigrants | Lithuania | 100.0 /100 | #14 | Exceptional 1.9% |
| Immigrants | Eastern Asia | 100.0 /100 | #15 | Exceptional 1.9% |
| Immigrants | Iran | 100.0 /100 | #16 | Exceptional 1.9% |
| Immigrants | India | 100.0 /100 | #17 | Exceptional 1.9% |
| Indians (Asian) | 100.0 /100 | #18 | Exceptional 1.9% |
| Iranians | 100.0 /100 | #19 | Exceptional 1.9% |
| Thais | 100.0 /100 | #20 | Exceptional 1.9% |
| Immigrants | Albania | 100.0 /100 | #21 | Exceptional 1.9% |
| Immigrants | Latvia | 100.0 /100 | #22 | Exceptional 1.9% |
| Immigrants | Croatia | 100.0 /100 | #23 | Exceptional 2.0% |
| Immigrants | Russia | 100.0 /100 | #24 | Exceptional 2.0% |
| Eastern Europeans | 100.0 /100 | #25 | Exceptional 2.0% |
Demographics Similar to Immigrants from Fiji by Single Father Households
In terms of single father households, the demographic groups most similar to Immigrants from Fiji are Choctaw (2.7%, a difference of 0.16%), Malaysian (2.7%, a difference of 0.43%), Blackfeet (2.7%, a difference of 0.62%), Puget Sound Salish (2.7%, a difference of 1.2%), and Chickasaw (2.8%, a difference of 1.2%).
| Demographics | Rating | Rank | Single Father Households |
| Immigrants | Cuba | 0.1 /100 | #286 | Tragic 2.7% |
| Central American Indians | 0.0 /100 | #287 | Tragic 2.7% |
| Immigrants | Cambodia | 0.0 /100 | #288 | Tragic 2.7% |
| Tlingit-Haida | 0.0 /100 | #289 | Tragic 2.7% |
| Puget Sound Salish | 0.0 /100 | #290 | Tragic 2.7% |
| Blackfeet | 0.0 /100 | #291 | Tragic 2.7% |
| Choctaw | 0.0 /100 | #292 | Tragic 2.7% |
| Immigrants | Fiji | 0.0 /100 | #293 | Tragic 2.7% |
| Malaysians | 0.0 /100 | #294 | Tragic 2.7% |
| Chickasaw | 0.0 /100 | #295 | Tragic 2.8% |
| Japanese | 0.0 /100 | #296 | Tragic 2.8% |
| Hondurans | 0.0 /100 | #297 | Tragic 2.8% |
| Cree | 0.0 /100 | #298 | Tragic 2.8% |
| Lumbee | 0.0 /100 | #299 | Tragic 2.8% |
| Kiowa | 0.0 /100 | #300 | Tragic 2.8% |