Indian (Asian) vs Ethiopian Single Father Households

COMPARE

Indian (Asian)
Race
Ancestry
AfghanAfricanAlaska NativeAlaskan AthabascanAlbanianAleutAlsatianAmericanApacheArabArapahoArgentineanArmenianAssyrian/Chaldean/SyriacAustralianAustrianBahamianBangladeshiBarbadianBasqueBelgianBelizeanBermudanBhutaneseBlackfeetBolivianBrazilianBritishBritish West IndianBulgarianBurmeseCajunCambodianCanadianCape VerdeanCarpatho RusynCelticCentral AmericanCentral American IndianCherokeeCheyenneChickasawChileanChineseChippewaChoctawColombianColvilleComancheCosta RicanCreeCreekCroatianCrowCubanCypriotCzechCzechoslovakianDanishDelawareDominicanDutchDutch West IndianEastern EuropeanEcuadorianEgyptianEnglishEstonianEuropeanFijianFilipinoFinnishFrenchFrench American IndianFrench CanadianGermanGerman RussianGhanaianGreekGuamanian/ChamorroGuatemalanGuyaneseHaitianHmongHonduranHopiHoumaHungarianIcelanderIndian (Asian)IndonesianInupiatIranianIraqiIrishIroquoisIsraeliItalianJamaicanJapaneseJordanianKenyanKiowaKoreanLaotianLatvianLebaneseLiberianLithuanianLumbeeLuxembourgerMacedonianMalaysianMalteseMarshalleseMenomineeMexicanMexican American IndianMongolianMoroccanNative HawaiianNavajoNepaleseNew ZealanderNicaraguanNigerianNorthern EuropeanNorwegianOkinawanOsageOttawaPaiutePakistaniPalestinianPanamanianParaguayanPennsylvania GermanPeruvianPimaPolishPortuguesePotawatomiPuebloPuerto RicanPuget Sound SalishRomanianRussianSalvadoranSamoanScandinavianScotch-IrishScottishSeminoleSenegaleseSerbianShoshoneSierra LeoneanSiouxSlavicSlovakSloveneSomaliSouth AfricanSouth AmericanSouth American IndianSoviet UnionSpaniardSpanishSpanish AmericanSpanish American IndianSri LankanSubsaharan AfricanSudaneseSwedishSwissSyrianTaiwaneseThaiTlingit-HaidaTohono O'OdhamTonganTrinidadian and TobagonianTsimshianTurkishU.S. Virgin IslanderUgandanUkrainianUruguayanUteVenezuelanVietnameseWelshWest IndianYakamaYaquiYugoslavianYumanYup'ikZimbabwean
Immigration
NonimmigrantsImmigrantsAfghanistanAfricaAlbaniaArgentinaArmeniaAsiaAustraliaAustriaBahamasBangladeshBarbadosBelarusBelgiumBelizeBoliviaBosnia and HerzegovinaBrazilBulgariaBurma/MyanmarCabo VerdeCambodiaCameroonCanadaCaribbeanCentral AmericaChileChinaColombiaCongoCosta RicaCroatiaCubaCzechoslovakiaDenmarkDominicaDominican RepublicEastern AfricaEastern AsiaEastern EuropeEcuadorEgyptEl SalvadorEnglandEritreaEthiopiaEuropeFijiFranceGermanyGhanaGreeceGrenadaGuatemalaGuyanaHaitiHondurasHong KongHungaryIndiaIndonesiaIranIraqIrelandIsraelItalyJamaicaJapanJordanKazakhstanKenyaKoreaKuwaitLaosLatin AmericaLatviaLebanonLiberiaLithuaniaMalaysiaMexicoMicronesiaMiddle AfricaMoldovaMoroccoNepalNetherlandsNicaraguaNigeriaNorth AmericaNorth MacedoniaNorthern AfricaNorthern EuropeNorwayOceaniaPakistanPanamaPeruPhilippinesPolandPortugalRomaniaRussiaSaudi ArabiaScotlandSenegalSerbiaSierra LeoneSingaporeSomaliaSouth AfricaSouth AmericaSouth Central AsiaSouth Eastern AsiaSouthern EuropeSpainSri LankaSt. Vincent and the GrenadinesSudanSwedenSwitzerlandSyriaTaiwanThailandTrinidad and TobagoTurkeyUgandaUkraineUruguayUzbekistanVenezuelaVietnamWest IndiesWestern AfricaWestern AsiaWestern EuropeYemenZaireZimbabweAzores
Ethiopian
Race
Ancestry
AfghanAfricanAlaska NativeAlaskan AthabascanAlbanianAleutAlsatianAmericanApacheArabArapahoArgentineanArmenianAssyrian/Chaldean/SyriacAustralianAustrianBahamianBangladeshiBarbadianBasqueBelgianBelizeanBermudanBhutaneseBlackfeetBolivianBrazilianBritishBritish West IndianBulgarianBurmeseCajunCambodianCanadianCape VerdeanCarpatho RusynCelticCentral AmericanCentral American IndianCherokeeCheyenneChickasawChileanChineseChippewaChoctawColombianColvilleComancheCosta RicanCreeCreekCroatianCrowCubanCypriotCzechCzechoslovakianDanishDelawareDominicanDutchDutch West IndianEastern EuropeanEcuadorianEgyptianEnglishEstonianEthiopianEuropeanFijianFilipinoFinnishFrenchFrench American IndianFrench CanadianGermanGerman RussianGhanaianGreekGuamanian/ChamorroGuatemalanGuyaneseHaitianHmongHonduranHopiHoumaHungarianIcelanderIndonesianInupiatIranianIraqiIrishIroquoisIsraeliItalianJamaicanJapaneseJordanianKenyanKiowaKoreanLaotianLatvianLebaneseLiberianLithuanianLumbeeLuxembourgerMacedonianMalaysianMalteseMarshalleseMenomineeMexicanMexican American IndianMongolianMoroccanNative HawaiianNavajoNepaleseNew ZealanderNicaraguanNigerianNorthern EuropeanNorwegianOkinawanOsageOttawaPaiutePakistaniPalestinianPanamanianParaguayanPennsylvania GermanPeruvianPimaPolishPortuguesePotawatomiPuebloPuerto RicanPuget Sound SalishRomanianRussianSalvadoranSamoanScandinavianScotch-IrishScottishSeminoleSenegaleseSerbianShoshoneSierra LeoneanSiouxSlavicSlovakSloveneSomaliSouth AfricanSouth AmericanSouth American IndianSoviet UnionSpaniardSpanishSpanish AmericanSpanish American IndianSri LankanSubsaharan AfricanSudaneseSwedishSwissSyrianTaiwaneseThaiTlingit-HaidaTohono O'OdhamTonganTrinidadian and TobagonianTsimshianTurkishU.S. Virgin IslanderUgandanUkrainianUruguayanUteVenezuelanVietnameseWelshWest IndianYakamaYaquiYugoslavianYumanYup'ikZimbabwean
Immigration
NonimmigrantsImmigrantsAfghanistanAfricaAlbaniaArgentinaArmeniaAsiaAustraliaAustriaBahamasBangladeshBarbadosBelarusBelgiumBelizeBoliviaBosnia and HerzegovinaBrazilBulgariaBurma/MyanmarCabo VerdeCambodiaCameroonCanadaCaribbeanCentral AmericaChileChinaColombiaCongoCosta RicaCroatiaCubaCzechoslovakiaDenmarkDominicaDominican RepublicEastern AfricaEastern AsiaEastern EuropeEcuadorEgyptEl SalvadorEnglandEritreaEthiopiaEuropeFijiFranceGermanyGhanaGreeceGrenadaGuatemalaGuyanaHaitiHondurasHong KongHungaryIndiaIndonesiaIranIraqIrelandIsraelItalyJamaicaJapanJordanKazakhstanKenyaKoreaKuwaitLaosLatin AmericaLatviaLebanonLiberiaLithuaniaMalaysiaMexicoMicronesiaMiddle AfricaMoldovaMoroccoNepalNetherlandsNicaraguaNigeriaNorth AmericaNorth MacedoniaNorthern AfricaNorthern EuropeNorwayOceaniaPakistanPanamaPeruPhilippinesPolandPortugalRomaniaRussiaSaudi ArabiaScotlandSenegalSerbiaSierra LeoneSingaporeSomaliaSouth AfricaSouth AmericaSouth Central AsiaSouth Eastern AsiaSouthern EuropeSpainSri LankaSt. Vincent and the GrenadinesSudanSwedenSwitzerlandSyriaTaiwanThailandTrinidad and TobagoTurkeyUgandaUkraineUruguayUzbekistanVenezuelaVietnamWest IndiesWestern AfricaWestern AsiaWestern EuropeYemenZaireZimbabweAzores
Single Father Households
Income
Poverty
Unemployment
Labor Participation
Family Structure
Vehicle Availability
Education Level
Disability

Single Father Households Comparison

Indians (Asian)

Ethiopians

Exceptional
Poor
1.9%
SINGLE FATHER HOUSEHOLDS
100.0/ 100
METRIC RATING
18th/ 347
METRIC RANK
2.4%
SINGLE FATHER HOUSEHOLDS
16.6/ 100
METRIC RATING
214th/ 347
METRIC RANK

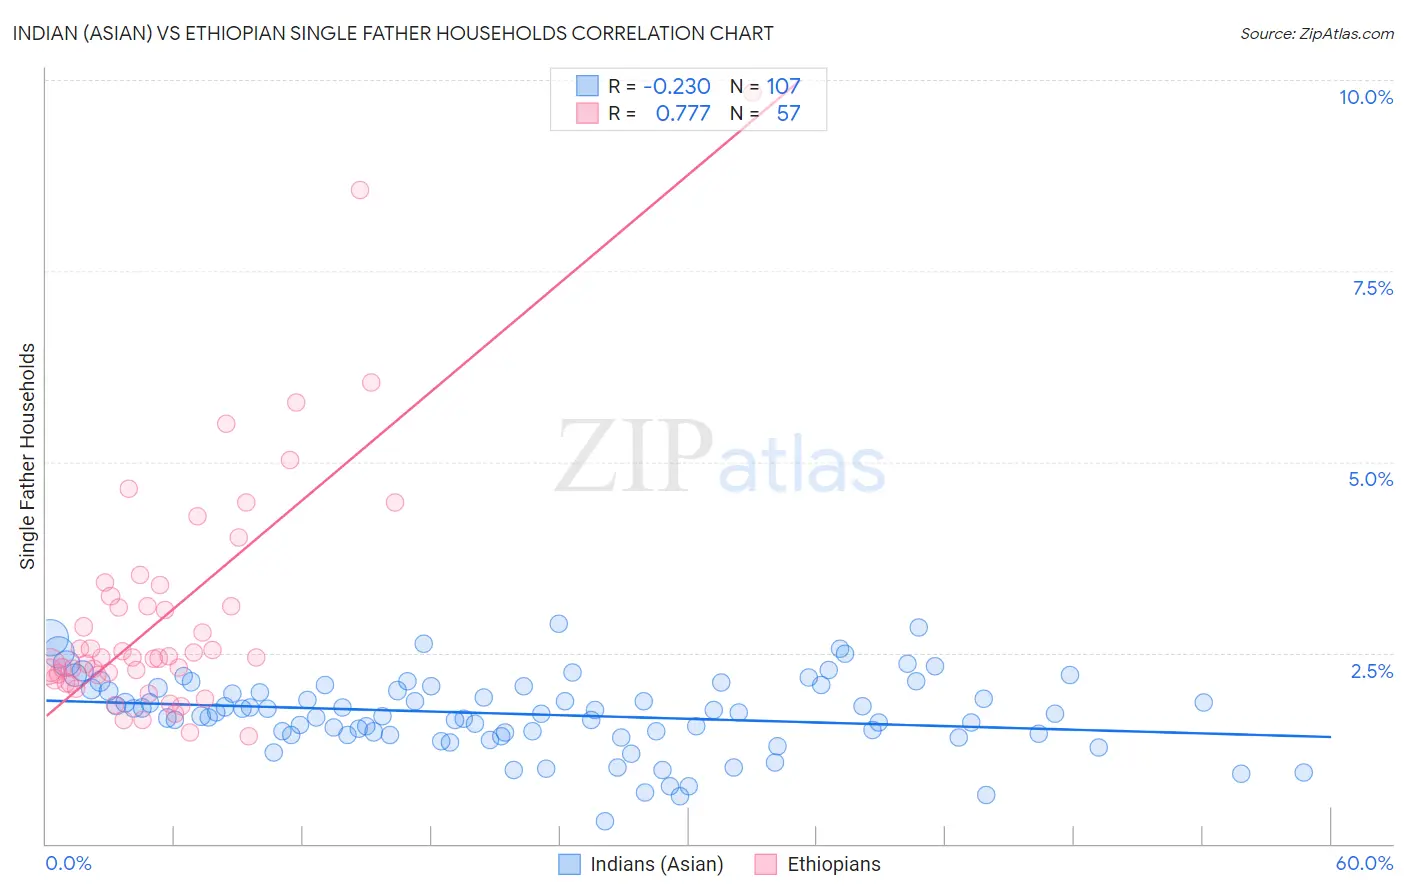
Indian (Asian) vs Ethiopian Single Father Households Correlation Chart

The statistical analysis conducted on geographies consisting of 488,421,643 people shows a weak negative correlation between the proportion of Indians (Asian) and percentage of single father households in the United States with a correlation coefficient (R) of -0.230 and weighted average of 1.9%. Similarly, the statistical analysis conducted on geographies consisting of 222,457,942 people shows a strong positive correlation between the proportion of Ethiopians and percentage of single father households in the United States with a correlation coefficient (R) of 0.777 and weighted average of 2.4%, a difference of 26.3%.
Indian (Asian) vs Ethiopian Single Father Households

Single Father Households Correlation Summary

MeasurementIndian (Asian)Ethiopian
Minimum0.29%1.4%
Maximum2.9%9.8%
Range2.6%8.4%
Mean1.7%3.0%
Median1.7%2.4%
Interquartile 25% (IQ1)1.4%2.2%
Interquartile 75% (IQ3)2.0%3.3%
Interquartile Range (IQR)0.61%1.1%
Standard Deviation (Sample)0.49%1.6%
Standard Deviation (Population)0.49%1.6%

Similar Demographics by Single Father Households

Demographics Similar to Indians (Asian) by Single Father Households

In terms of single father households, the demographic groups most similar to Indians (Asian) are Immigrants from India (1.9%, a difference of 0.50%), Immigrants from Iran (1.9%, a difference of 0.72%), Iranian (1.9%, a difference of 0.84%), Thai (1.9%, a difference of 0.91%), and Immigrants from Eastern Asia (1.9%, a difference of 0.93%).
DemographicsRating | RankSingle Father Households
Immigrants | Belarus
100.0
/100
|
#11
Exceptional
1.9%
Immigrants | Greece
100.0
/100
|
#12
Exceptional
1.9%
Immigrants | Singapore
100.0
/100
|
#13
Exceptional
1.9%
Immigrants | Lithuania
100.0
/100
|
#14
Exceptional
1.9%
Immigrants | Eastern Asia
100.0
/100
|
#15
Exceptional
1.9%
Immigrants | Iran
100.0
/100
|
#16
Exceptional
1.9%
Immigrants | India
100.0
/100
|
#17
Exceptional
1.9%
Indians (Asian)
100.0
/100
|
#18
Exceptional
1.9%
Iranians
100.0
/100
|
#19
Exceptional
1.9%
Thais
100.0
/100
|
#20
Exceptional
1.9%
Immigrants | Albania
100.0
/100
|
#21
Exceptional
1.9%
Immigrants | Latvia
100.0
/100
|
#22
Exceptional
1.9%
Immigrants | Croatia
100.0
/100
|
#23
Exceptional
2.0%
Immigrants | Russia
100.0
/100
|
#24
Exceptional
2.0%
Eastern Europeans
100.0
/100
|
#25
Exceptional
2.0%

Demographics Similar to Ethiopians by Single Father Households

In terms of single father households, the demographic groups most similar to Ethiopians are Norwegian (2.4%, a difference of 0.060%), Immigrants from South Eastern Asia (2.4%, a difference of 0.090%), Finnish (2.4%, a difference of 0.21%), Immigrants from Ecuador (2.4%, a difference of 0.23%), and Immigrants from Nigeria (2.4%, a difference of 0.26%).
DemographicsRating | RankSingle Father Households
Whites/Caucasians
22.6
/100
|
#207
Fair
2.4%
Immigrants | Kenya
20.3
/100
|
#208
Fair
2.4%
Immigrants | Peru
19.3
/100
|
#209
Poor
2.4%
Immigrants | Costa Rica
19.2
/100
|
#210
Poor
2.4%
Immigrants | Nigeria
18.7
/100
|
#211
Poor
2.4%
Finns
18.3
/100
|
#212
Poor
2.4%
Norwegians
17.1
/100
|
#213
Poor
2.4%
Ethiopians
16.6
/100
|
#214
Poor
2.4%
Immigrants | South Eastern Asia
15.9
/100
|
#215
Poor
2.4%
Immigrants | Ecuador
14.9
/100
|
#216
Poor
2.4%
Dutch
14.3
/100
|
#217
Poor
2.4%
Immigrants | Ethiopia
13.4
/100
|
#218
Poor
2.4%
Sudanese
13.0
/100
|
#219
Poor
2.4%
Ghanaians
12.9
/100
|
#220
Poor
2.4%
Immigrants | Burma/Myanmar
12.1
/100
|
#221
Poor
2.4%