Cape Verdean vs Immigrants from Northern Europe Births to Unmarried Women

COMPARE

Cape Verdean
Race
Ancestry
AfghanAfricanAlaska NativeAlaskan AthabascanAlbanianAleutAlsatianAmericanApacheArabArapahoArgentineanArmenianAssyrian/Chaldean/SyriacAustralianAustrianBahamianBangladeshiBarbadianBasqueBelgianBelizeanBermudanBhutaneseBlackfeetBolivianBrazilianBritishBritish West IndianBulgarianBurmeseCajunCambodianCanadianCape VerdeanCarpatho RusynCelticCentral AmericanCentral American IndianCherokeeCheyenneChickasawChileanChineseChippewaChoctawColombianColvilleComancheCosta RicanCreeCreekCroatianCrowCubanCypriotCzechCzechoslovakianDanishDelawareDominicanDutchDutch West IndianEastern EuropeanEcuadorianEgyptianEnglishEstonianEthiopianEuropeanFijianFilipinoFinnishFrenchFrench American IndianFrench CanadianGermanGerman RussianGhanaianGreekGuamanian/ChamorroGuatemalanGuyaneseHaitianHmongHonduranHopiHoumaHungarianIcelanderIndian (Asian)IndonesianInupiatIranianIraqiIrishIroquoisIsraeliItalianJamaicanJapaneseJordanianKenyanKiowaKoreanLaotianLatvianLebaneseLiberianLithuanianLumbeeLuxembourgerMacedonianMalaysianMalteseMarshalleseMenomineeMexicanMexican American IndianMongolianMoroccanNative HawaiianNavajoNepaleseNew ZealanderNicaraguanNigerianNorthern EuropeanNorwegianOkinawanOsageOttawaPaiutePakistaniPalestinianPanamanianParaguayanPennsylvania GermanPeruvianPimaPolishPortuguesePotawatomiPuebloPuerto RicanPuget Sound SalishRomanianRussianSalvadoranSamoanScandinavianScotch-IrishScottishSeminoleSenegaleseSerbianShoshoneSierra LeoneanSiouxSlavicSlovakSloveneSomaliSouth AfricanSouth AmericanSouth American IndianSoviet UnionSpaniardSpanishSpanish AmericanSpanish American IndianSri LankanSubsaharan AfricanSudaneseSwedishSwissSyrianTaiwaneseThaiTlingit-HaidaTohono O'OdhamTonganTrinidadian and TobagonianTsimshianTurkishU.S. Virgin IslanderUgandanUkrainianUruguayanUteVenezuelanVietnameseWelshWest IndianYakamaYaquiYugoslavianYumanYup'ikZimbabwean
Immigration
NonimmigrantsImmigrantsAfghanistanAfricaAlbaniaArgentinaArmeniaAsiaAustraliaAustriaBahamasBangladeshBarbadosBelarusBelgiumBelizeBoliviaBosnia and HerzegovinaBrazilBulgariaBurma/MyanmarCabo VerdeCambodiaCameroonCanadaCaribbeanCentral AmericaChileChinaColombiaCongoCosta RicaCroatiaCubaCzechoslovakiaDenmarkDominicaDominican RepublicEastern AfricaEastern AsiaEastern EuropeEcuadorEgyptEl SalvadorEnglandEritreaEthiopiaEuropeFijiFranceGermanyGhanaGreeceGrenadaGuatemalaGuyanaHaitiHondurasHong KongHungaryIndiaIndonesiaIranIraqIrelandIsraelItalyJamaicaJapanJordanKazakhstanKenyaKoreaKuwaitLaosLatin AmericaLatviaLebanonLiberiaLithuaniaMalaysiaMexicoMicronesiaMiddle AfricaMoldovaMoroccoNepalNetherlandsNicaraguaNigeriaNorth AmericaNorth MacedoniaNorthern AfricaNorwayOceaniaPakistanPanamaPeruPhilippinesPolandPortugalRomaniaRussiaSaudi ArabiaScotlandSenegalSerbiaSierra LeoneSingaporeSomaliaSouth AfricaSouth AmericaSouth Central AsiaSouth Eastern AsiaSouthern EuropeSpainSri LankaSt. Vincent and the GrenadinesSudanSwedenSwitzerlandSyriaTaiwanThailandTrinidad and TobagoTurkeyUgandaUkraineUruguayUzbekistanVenezuelaVietnamWest IndiesWestern AfricaWestern AsiaWestern EuropeYemenZaireZimbabweAzores
Immigrants from Northern Europe
Race
Ancestry
AfghanAfricanAlaska NativeAlaskan AthabascanAlbanianAleutAlsatianAmericanApacheArabArapahoArgentineanArmenianAssyrian/Chaldean/SyriacAustralianAustrianBahamianBangladeshiBarbadianBasqueBelgianBelizeanBermudanBhutaneseBlackfeetBolivianBrazilianBritishBritish West IndianBulgarianBurmeseCajunCambodianCanadianCarpatho RusynCelticCentral AmericanCentral American IndianCherokeeCheyenneChickasawChileanChineseChippewaChoctawColombianColvilleComancheCosta RicanCreeCreekCroatianCrowCubanCypriotCzechCzechoslovakianDanishDelawareDominicanDutchDutch West IndianEastern EuropeanEcuadorianEgyptianEnglishEstonianEthiopianEuropeanFijianFilipinoFinnishFrenchFrench American IndianFrench CanadianGermanGerman RussianGhanaianGreekGuamanian/ChamorroGuatemalanGuyaneseHaitianHmongHonduranHopiHoumaHungarianIcelanderIndian (Asian)IndonesianInupiatIranianIraqiIrishIroquoisIsraeliItalianJamaicanJapaneseJordanianKenyanKiowaKoreanLaotianLatvianLebaneseLiberianLithuanianLumbeeLuxembourgerMacedonianMalaysianMalteseMarshalleseMenomineeMexicanMexican American IndianMongolianMoroccanNative HawaiianNavajoNepaleseNew ZealanderNicaraguanNigerianNorthern EuropeanNorwegianOkinawanOsageOttawaPaiutePakistaniPalestinianPanamanianParaguayanPennsylvania GermanPeruvianPimaPolishPortuguesePotawatomiPuebloPuerto RicanPuget Sound SalishRomanianRussianSalvadoranSamoanScandinavianScotch-IrishScottishSeminoleSenegaleseSerbianShoshoneSierra LeoneanSiouxSlavicSlovakSloveneSomaliSouth AfricanSouth AmericanSouth American IndianSoviet UnionSpaniardSpanishSpanish AmericanSpanish American IndianSri LankanSubsaharan AfricanSudaneseSwedishSwissSyrianTaiwaneseThaiTlingit-HaidaTohono O'OdhamTonganTrinidadian and TobagonianTsimshianTurkishU.S. Virgin IslanderUgandanUkrainianUruguayanUteVenezuelanVietnameseWelshWest IndianYakamaYaquiYugoslavianYumanYup'ikZimbabwean
Immigration
NonimmigrantsImmigrantsAfghanistanAfricaAlbaniaArgentinaArmeniaAsiaAustraliaAustriaBahamasBangladeshBarbadosBelarusBelgiumBelizeBoliviaBosnia and HerzegovinaBrazilBulgariaBurma/MyanmarCabo VerdeCambodiaCameroonCanadaCaribbeanCentral AmericaChileChinaColombiaCongoCosta RicaCroatiaCubaCzechoslovakiaDenmarkDominicaDominican RepublicEastern AfricaEastern AsiaEastern EuropeEcuadorEgyptEl SalvadorEnglandEritreaEthiopiaEuropeFijiFranceGermanyGhanaGreeceGrenadaGuatemalaGuyanaHaitiHondurasHong KongHungaryIndiaIndonesiaIranIraqIrelandIsraelItalyJamaicaJapanJordanKazakhstanKenyaKoreaKuwaitLaosLatin AmericaLatviaLebanonLiberiaLithuaniaMalaysiaMexicoMicronesiaMiddle AfricaMoldovaMoroccoNepalNetherlandsNicaraguaNigeriaNorth AmericaNorth MacedoniaNorthern AfricaNorthern EuropeNorwayOceaniaPakistanPanamaPeruPhilippinesPolandPortugalRomaniaRussiaSaudi ArabiaScotlandSenegalSerbiaSierra LeoneSingaporeSomaliaSouth AfricaSouth AmericaSouth Central AsiaSouth Eastern AsiaSouthern EuropeSpainSri LankaSt. Vincent and the GrenadinesSudanSwedenSwitzerlandSyriaTaiwanThailandTrinidad and TobagoTurkeyUgandaUkraineUruguayUzbekistanVenezuelaVietnamWest IndiesWestern AfricaWestern AsiaWestern EuropeYemenZaireZimbabweAzores
Births to Unmarried Women
Income
Poverty
Unemployment
Labor Participation
Family Structure
Vehicle Availability
Education Level
Disability

Births to Unmarried Women Comparison

Cape Verdeans

Immigrants from Northern Europe

Tragic
Exceptional
41.3%
BIRTHS TO UNMARRIED WOMEN
0.0/ 100
METRIC RATING
324th/ 347
METRIC RANK
28.6%
BIRTHS TO UNMARRIED WOMEN
98.3/ 100
METRIC RATING
77th/ 347
METRIC RANK

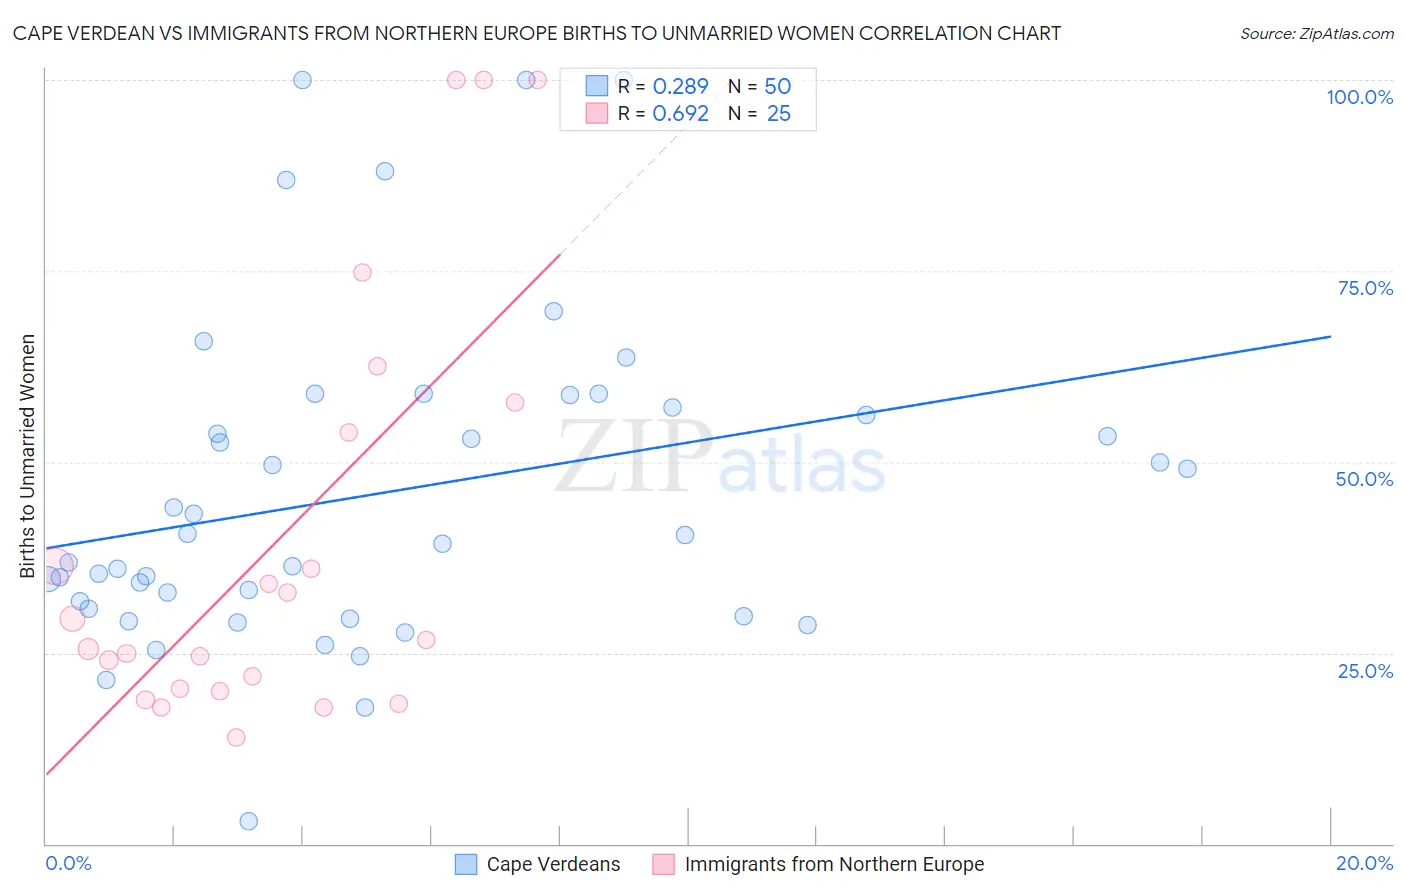
Cape Verdean vs Immigrants from Northern Europe Births to Unmarried Women Correlation Chart

The statistical analysis conducted on geographies consisting of 104,600,290 people shows a weak positive correlation between the proportion of Cape Verdeans and percentage of births to unmarried women in the United States with a correlation coefficient (R) of 0.289 and weighted average of 41.3%. Similarly, the statistical analysis conducted on geographies consisting of 435,574,051 people shows a significant positive correlation between the proportion of Immigrants from Northern Europe and percentage of births to unmarried women in the United States with a correlation coefficient (R) of 0.692 and weighted average of 28.6%, a difference of 44.3%.
Cape Verdean vs Immigrants from Northern Europe Births to Unmarried Women

Births to Unmarried Women Correlation Summary

MeasurementCape VerdeanImmigrants from Northern Europe
Minimum3.0%14.0%
Maximum100.0%100.0%
Range97.0%86.0%
Mean45.9%39.7%
Median39.8%26.6%
Interquartile 25% (IQ1)30.7%20.1%
Interquartile 75% (IQ3)57.2%55.9%
Interquartile Range (IQR)26.5%35.7%
Standard Deviation (Sample)21.5%27.4%
Standard Deviation (Population)21.3%26.9%

Similar Demographics by Births to Unmarried Women

Demographics Similar to Cape Verdeans by Births to Unmarried Women

In terms of births to unmarried women, the demographic groups most similar to Cape Verdeans are Cheyenne (41.3%, a difference of 0.060%), Immigrants from Cuba (41.5%, a difference of 0.33%), Sioux (41.0%, a difference of 0.80%), Cajun (41.0%, a difference of 0.87%), and Bahamian (40.8%, a difference of 1.4%).
DemographicsRating | RankBirths to Unmarried Women
Immigrants | Dominican Republic
0.0
/100
|
#317
Tragic
40.1%
Immigrants | Bahamas
0.0
/100
|
#318
Tragic
40.1%
Yakama
0.0
/100
|
#319
Tragic
40.3%
Crow
0.0
/100
|
#320
Tragic
40.4%
Bahamians
0.0
/100
|
#321
Tragic
40.8%
Cajuns
0.0
/100
|
#322
Tragic
41.0%
Sioux
0.0
/100
|
#323
Tragic
41.0%
Cape Verdeans
0.0
/100
|
#324
Tragic
41.3%
Cheyenne
0.0
/100
|
#325
Tragic
41.3%
Immigrants | Cuba
0.0
/100
|
#326
Tragic
41.5%
Tsimshian
0.0
/100
|
#327
Tragic
42.2%
Immigrants | Cabo Verde
0.0
/100
|
#328
Tragic
42.2%
Paiute
0.0
/100
|
#329
Tragic
42.5%
Chippewa
0.0
/100
|
#330
Tragic
42.6%
Natives/Alaskans
0.0
/100
|
#331
Tragic
43.0%

Demographics Similar to Immigrants from Northern Europe by Births to Unmarried Women

In terms of births to unmarried women, the demographic groups most similar to Immigrants from Northern Europe are Zimbabwean (28.7%, a difference of 0.16%), Israeli (28.6%, a difference of 0.19%), Danish (28.7%, a difference of 0.19%), Immigrants from Switzerland (28.6%, a difference of 0.21%), and Immigrants from Afghanistan (28.7%, a difference of 0.21%).
DemographicsRating | RankBirths to Unmarried Women
Laotians
98.6
/100
|
#70
Exceptional
28.5%
Jordanians
98.5
/100
|
#71
Exceptional
28.5%
Immigrants | Sweden
98.5
/100
|
#72
Exceptional
28.5%
Albanians
98.5
/100
|
#73
Exceptional
28.5%
Immigrants | Bolivia
98.5
/100
|
#74
Exceptional
28.6%
Immigrants | Switzerland
98.4
/100
|
#75
Exceptional
28.6%
Israelis
98.4
/100
|
#76
Exceptional
28.6%
Immigrants | Northern Europe
98.3
/100
|
#77
Exceptional
28.6%
Zimbabweans
98.2
/100
|
#78
Exceptional
28.7%
Danes
98.2
/100
|
#79
Exceptional
28.7%
Immigrants | Afghanistan
98.1
/100
|
#80
Exceptional
28.7%
Immigrants | Austria
98.1
/100
|
#81
Exceptional
28.7%
Romanians
98.0
/100
|
#82
Exceptional
28.7%
Immigrants | Kuwait
98.0
/100
|
#83
Exceptional
28.8%
Immigrants | Poland
97.6
/100
|
#84
Exceptional
28.9%