Norwegian vs Aleut College, 1 year or more
COMPARE
Norwegian
Aleut
College, 1 year or more
College, 1 year or more Comparison
Norwegians
Aleuts
61.7%
COLLEGE, 1 YEAR OR MORE
94.5/ 100
METRIC RATING
115th/ 347
METRIC RANK
55.4%
COLLEGE, 1 YEAR OR MORE
0.6/ 100
METRIC RATING
252nd/ 347
METRIC RANK
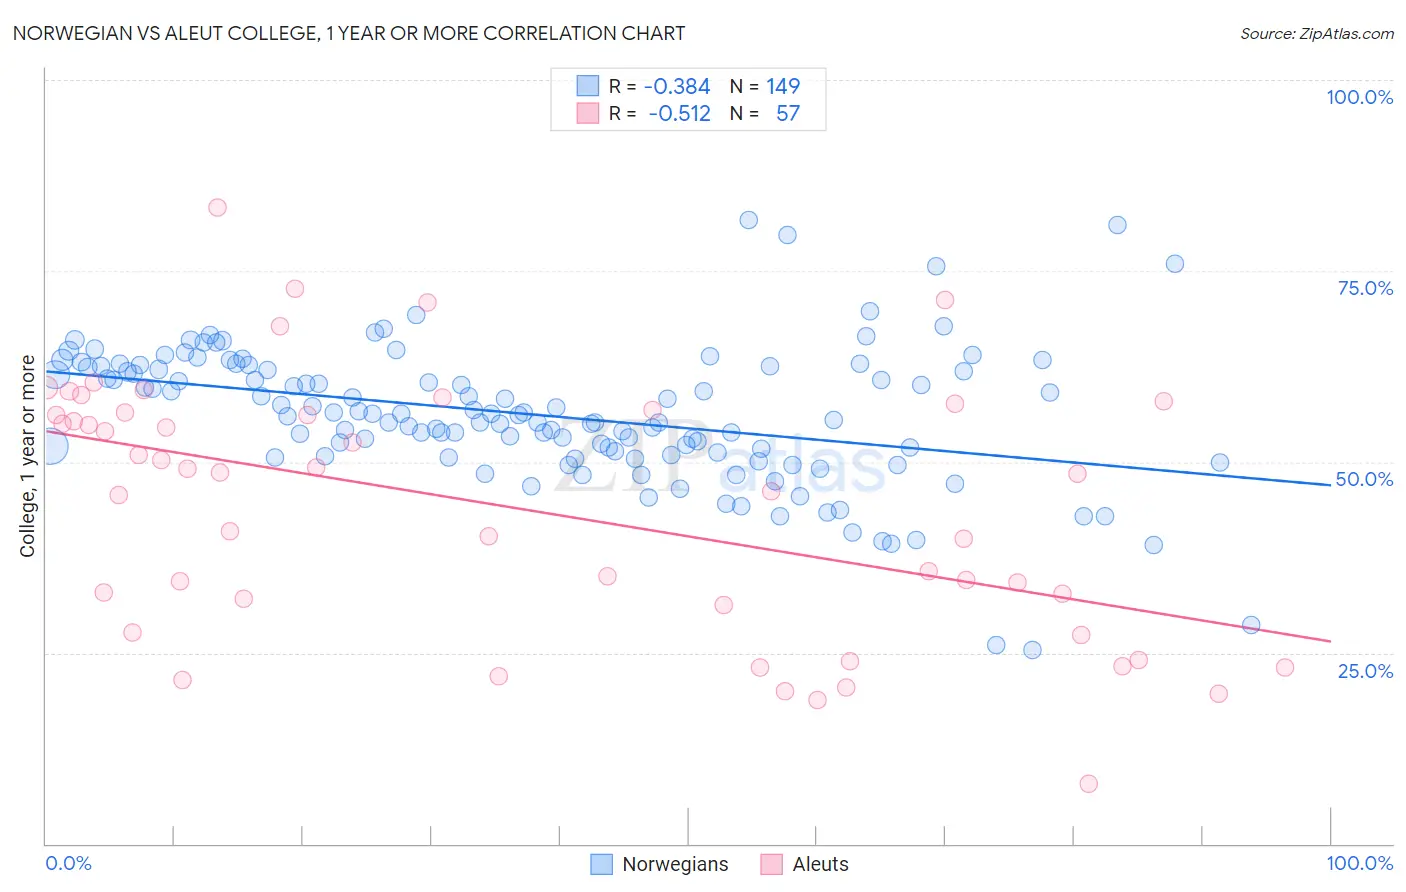
Norwegian vs Aleut College, 1 year or more Correlation Chart
The statistical analysis conducted on geographies consisting of 533,389,627 people shows a mild negative correlation between the proportion of Norwegians and percentage of population with at least college, 1 year or more education in the United States with a correlation coefficient (R) of -0.384 and weighted average of 61.7%. Similarly, the statistical analysis conducted on geographies consisting of 61,782,916 people shows a substantial negative correlation between the proportion of Aleuts and percentage of population with at least college, 1 year or more education in the United States with a correlation coefficient (R) of -0.512 and weighted average of 55.4%, a difference of 11.2%.
College, 1 year or more Correlation Summary
| Measurement | Norwegian | Aleut |
| Minimum | 25.4% | 7.9% |
| Maximum | 81.7% | 83.3% |
| Range | 56.3% | 75.4% |
| Mean | 56.1% | 43.9% |
| Median | 56.3% | 48.5% |
| Interquartile 25% (IQ1) | 51.0% | 29.5% |
| Interquartile 75% (IQ3) | 62.5% | 56.7% |
| Interquartile Range (IQR) | 11.4% | 27.2% |
| Standard Deviation (Sample) | 9.1% | 16.9% |
| Standard Deviation (Population) | 9.1% | 16.7% |
Similar Demographics by College, 1 year or more
Demographics Similar to Norwegians by College, 1 year or more
In terms of college, 1 year or more, the demographic groups most similar to Norwegians are Danish (61.7%, a difference of 0.070%), Lebanese (61.6%, a difference of 0.10%), Arab (61.6%, a difference of 0.14%), Immigrants from Brazil (61.6%, a difference of 0.15%), and Ukrainian (61.8%, a difference of 0.18%).
| Demographics | Rating | Rank | College, 1 year or more |
| Syrians | 95.7 /100 | #108 | Exceptional 61.9% |
| Immigrants | Northern Africa | 95.7 /100 | #109 | Exceptional 61.9% |
| Europeans | 95.6 /100 | #110 | Exceptional 61.8% |
| Macedonians | 95.6 /100 | #111 | Exceptional 61.8% |
| Austrians | 95.4 /100 | #112 | Exceptional 61.8% |
| Ukrainians | 95.2 /100 | #113 | Exceptional 61.8% |
| Danes | 94.8 /100 | #114 | Exceptional 61.7% |
| Norwegians | 94.5 /100 | #115 | Exceptional 61.7% |
| Lebanese | 94.1 /100 | #116 | Exceptional 61.6% |
| Arabs | 93.9 /100 | #117 | Exceptional 61.6% |
| Immigrants | Brazil | 93.9 /100 | #118 | Exceptional 61.6% |
| Assyrians/Chaldeans/Syriacs | 93.3 /100 | #119 | Exceptional 61.5% |
| Pakistanis | 93.2 /100 | #120 | Exceptional 61.5% |
| Immigrants | Jordan | 92.7 /100 | #121 | Exceptional 61.4% |
| Immigrants | Chile | 92.3 /100 | #122 | Exceptional 61.4% |
Demographics Similar to Aleuts by College, 1 year or more
In terms of college, 1 year or more, the demographic groups most similar to Aleuts are Immigrants from Cambodia (55.4%, a difference of 0.030%), Immigrants from Barbados (55.4%, a difference of 0.11%), Delaware (55.5%, a difference of 0.12%), Immigrants from Trinidad and Tobago (55.5%, a difference of 0.14%), and Immigrants from Congo (55.6%, a difference of 0.24%).
| Demographics | Rating | Rank | College, 1 year or more |
| Immigrants | Liberia | 0.8 /100 | #245 | Tragic 55.7% |
| Malaysians | 0.8 /100 | #246 | Tragic 55.6% |
| Hawaiians | 0.8 /100 | #247 | Tragic 55.6% |
| Immigrants | Congo | 0.8 /100 | #248 | Tragic 55.6% |
| Immigrants | Trinidad and Tobago | 0.7 /100 | #249 | Tragic 55.5% |
| Delaware | 0.7 /100 | #250 | Tragic 55.5% |
| Immigrants | Cambodia | 0.6 /100 | #251 | Tragic 55.4% |
| Aleuts | 0.6 /100 | #252 | Tragic 55.4% |
| Immigrants | Barbados | 0.6 /100 | #253 | Tragic 55.4% |
| Japanese | 0.5 /100 | #254 | Tragic 55.2% |
| Immigrants | Bahamas | 0.5 /100 | #255 | Tragic 55.2% |
| Immigrants | West Indies | 0.5 /100 | #256 | Tragic 55.2% |
| Indonesians | 0.4 /100 | #257 | Tragic 55.1% |
| Africans | 0.4 /100 | #258 | Tragic 55.0% |
| Nepalese | 0.3 /100 | #259 | Tragic 54.9% |