Marshallese vs Brazilian College, 1 year or more

COMPARE

Marshallese
Race
Ancestry
AfghanAfricanAlaska NativeAlaskan AthabascanAlbanianAleutAlsatianAmericanApacheArabArapahoArgentineanArmenianAssyrian/Chaldean/SyriacAustralianAustrianBahamianBangladeshiBarbadianBasqueBelgianBelizeanBermudanBhutaneseBlackfeetBolivianBritishBritish West IndianBulgarianBurmeseCajunCambodianCanadianCape VerdeanCarpatho RusynCelticCentral AmericanCentral American IndianCherokeeCheyenneChickasawChileanChineseChippewaChoctawColombianColvilleComancheCosta RicanCreeCreekCroatianCrowCubanCypriotCzechCzechoslovakianDanishDelawareDominicanDutchDutch West IndianEastern EuropeanEcuadorianEgyptianEnglishEstonianEthiopianEuropeanFijianFilipinoFinnishFrenchFrench American IndianFrench CanadianGermanGerman RussianGhanaianGreekGuamanian/ChamorroGuatemalanGuyaneseHaitianHmongHonduranHopiHoumaHungarianIcelanderIndian (Asian)IndonesianInupiatIranianIraqiIrishIroquoisIsraeliItalianJamaicanJapaneseJordanianKenyanKiowaKoreanLaotianLatvianLebaneseLiberianLithuanianLumbeeLuxembourgerMacedonianMalaysianMalteseMarshalleseMenomineeMexicanMexican American IndianMongolianMoroccanNative HawaiianNavajoNepaleseNew ZealanderNicaraguanNigerianNorthern EuropeanNorwegianOkinawanOsageOttawaPaiutePakistaniPalestinianPanamanianParaguayanPennsylvania GermanPeruvianPimaPolishPortuguesePotawatomiPuebloPuerto RicanPuget Sound SalishRomanianRussianSalvadoranSamoanScandinavianScotch-IrishScottishSeminoleSenegaleseSerbianShoshoneSierra LeoneanSiouxSlavicSlovakSloveneSomaliSouth AfricanSouth AmericanSouth American IndianSoviet UnionSpaniardSpanishSpanish AmericanSpanish American IndianSri LankanSubsaharan AfricanSudaneseSwedishSwissSyrianTaiwaneseThaiTlingit-HaidaTohono O'OdhamTonganTrinidadian and TobagonianTsimshianTurkishU.S. Virgin IslanderUgandanUkrainianUruguayanUteVenezuelanVietnameseWelshWest IndianYakamaYaquiYugoslavianYumanYup'ikZimbabwean
Immigration
NonimmigrantsImmigrantsAfghanistanAfricaAlbaniaArgentinaArmeniaAsiaAustraliaAustriaBahamasBangladeshBarbadosBelarusBelgiumBelizeBoliviaBosnia and HerzegovinaBrazilBulgariaBurma/MyanmarCabo VerdeCambodiaCameroonCanadaCaribbeanCentral AmericaChileChinaColombiaCongoCosta RicaCroatiaCubaCzechoslovakiaDenmarkDominicaDominican RepublicEastern AfricaEastern AsiaEastern EuropeEcuadorEgyptEl SalvadorEnglandEritreaEthiopiaEuropeFijiFranceGermanyGhanaGreeceGrenadaGuatemalaGuyanaHaitiHondurasHong KongHungaryIndiaIndonesiaIranIraqIrelandIsraelItalyJamaicaJapanJordanKazakhstanKenyaKoreaKuwaitLaosLatin AmericaLatviaLebanonLiberiaLithuaniaMalaysiaMexicoMicronesiaMiddle AfricaMoldovaMoroccoNepalNetherlandsNicaraguaNigeriaNorth AmericaNorth MacedoniaNorthern AfricaNorthern EuropeNorwayOceaniaPakistanPanamaPeruPhilippinesPolandPortugalRomaniaRussiaSaudi ArabiaScotlandSenegalSerbiaSierra LeoneSingaporeSomaliaSouth AfricaSouth AmericaSouth Central AsiaSouth Eastern AsiaSouthern EuropeSpainSri LankaSt. Vincent and the GrenadinesSudanSwedenSwitzerlandSyriaTaiwanThailandTrinidad and TobagoTurkeyUgandaUkraineUruguayUzbekistanVenezuelaVietnamWest IndiesWestern AfricaWestern AsiaWestern EuropeYemenZaireZimbabweAzores
Brazilian
Race
Ancestry
AfghanAfricanAlaska NativeAlaskan AthabascanAlbanianAleutAlsatianAmericanApacheArabArapahoArgentineanArmenianAssyrian/Chaldean/SyriacAustralianAustrianBahamianBangladeshiBarbadianBasqueBelgianBelizeanBermudanBhutaneseBlackfeetBolivianBrazilianBritishBritish West IndianBulgarianBurmeseCajunCambodianCanadianCape VerdeanCarpatho RusynCelticCentral AmericanCentral American IndianCherokeeCheyenneChickasawChileanChineseChippewaChoctawColombianColvilleComancheCosta RicanCreeCreekCroatianCrowCubanCypriotCzechCzechoslovakianDanishDelawareDominicanDutchDutch West IndianEastern EuropeanEcuadorianEgyptianEnglishEstonianEthiopianEuropeanFijianFilipinoFinnishFrenchFrench American IndianFrench CanadianGermanGerman RussianGhanaianGreekGuamanian/ChamorroGuatemalanGuyaneseHaitianHmongHonduranHopiHoumaHungarianIcelanderIndian (Asian)IndonesianInupiatIranianIraqiIrishIroquoisIsraeliItalianJamaicanJapaneseJordanianKenyanKiowaKoreanLaotianLatvianLebaneseLiberianLithuanianLumbeeLuxembourgerMacedonianMalaysianMalteseMenomineeMexicanMexican American IndianMongolianMoroccanNative HawaiianNavajoNepaleseNew ZealanderNicaraguanNigerianNorthern EuropeanNorwegianOkinawanOsageOttawaPaiutePakistaniPalestinianPanamanianParaguayanPennsylvania GermanPeruvianPimaPolishPortuguesePotawatomiPuebloPuerto RicanPuget Sound SalishRomanianRussianSalvadoranSamoanScandinavianScotch-IrishScottishSeminoleSenegaleseSerbianShoshoneSierra LeoneanSiouxSlavicSlovakSloveneSomaliSouth AfricanSouth AmericanSouth American IndianSoviet UnionSpaniardSpanishSpanish AmericanSpanish American IndianSri LankanSubsaharan AfricanSudaneseSwedishSwissSyrianTaiwaneseThaiTlingit-HaidaTohono O'OdhamTonganTrinidadian and TobagonianTsimshianTurkishU.S. Virgin IslanderUgandanUkrainianUruguayanUteVenezuelanVietnameseWelshWest IndianYakamaYaquiYugoslavianYumanYup'ikZimbabwean
Immigration
NonimmigrantsImmigrantsAfghanistanAfricaAlbaniaArgentinaArmeniaAsiaAustraliaAustriaBahamasBangladeshBarbadosBelarusBelgiumBelizeBoliviaBosnia and HerzegovinaBrazilBulgariaBurma/MyanmarCabo VerdeCambodiaCameroonCanadaCaribbeanCentral AmericaChileChinaColombiaCongoCosta RicaCroatiaCubaCzechoslovakiaDenmarkDominicaDominican RepublicEastern AfricaEastern AsiaEastern EuropeEcuadorEgyptEl SalvadorEnglandEritreaEthiopiaEuropeFijiFranceGermanyGhanaGreeceGrenadaGuatemalaGuyanaHaitiHondurasHong KongHungaryIndiaIndonesiaIranIraqIrelandIsraelItalyJamaicaJapanJordanKazakhstanKenyaKoreaKuwaitLaosLatin AmericaLatviaLebanonLiberiaLithuaniaMalaysiaMexicoMicronesiaMiddle AfricaMoldovaMoroccoNepalNetherlandsNicaraguaNigeriaNorth AmericaNorth MacedoniaNorthern AfricaNorthern EuropeNorwayOceaniaPakistanPanamaPeruPhilippinesPolandPortugalRomaniaRussiaSaudi ArabiaScotlandSenegalSerbiaSierra LeoneSingaporeSomaliaSouth AfricaSouth AmericaSouth Central AsiaSouth Eastern AsiaSouthern EuropeSpainSri LankaSt. Vincent and the GrenadinesSudanSwedenSwitzerlandSyriaTaiwanThailandTrinidad and TobagoTurkeyUgandaUkraineUruguayUzbekistanVenezuelaVietnamWest IndiesWestern AfricaWestern AsiaWestern EuropeYemenZaireZimbabweAzores
College, 1 year or more
Income
Poverty
Unemployment
Labor Participation
Family Structure
Vehicle Availability
Education Level
Disability

College, 1 year or more Comparison

Marshallese

Brazilians

Tragic
Good
55.8%
COLLEGE, 1 YEAR OR MORE
1.0/ 100
METRIC RATING
242nd/ 347
METRIC RANK
60.5%
COLLEGE, 1 YEAR OR MORE
79.0/ 100
METRIC RATING
149th/ 347
METRIC RANK

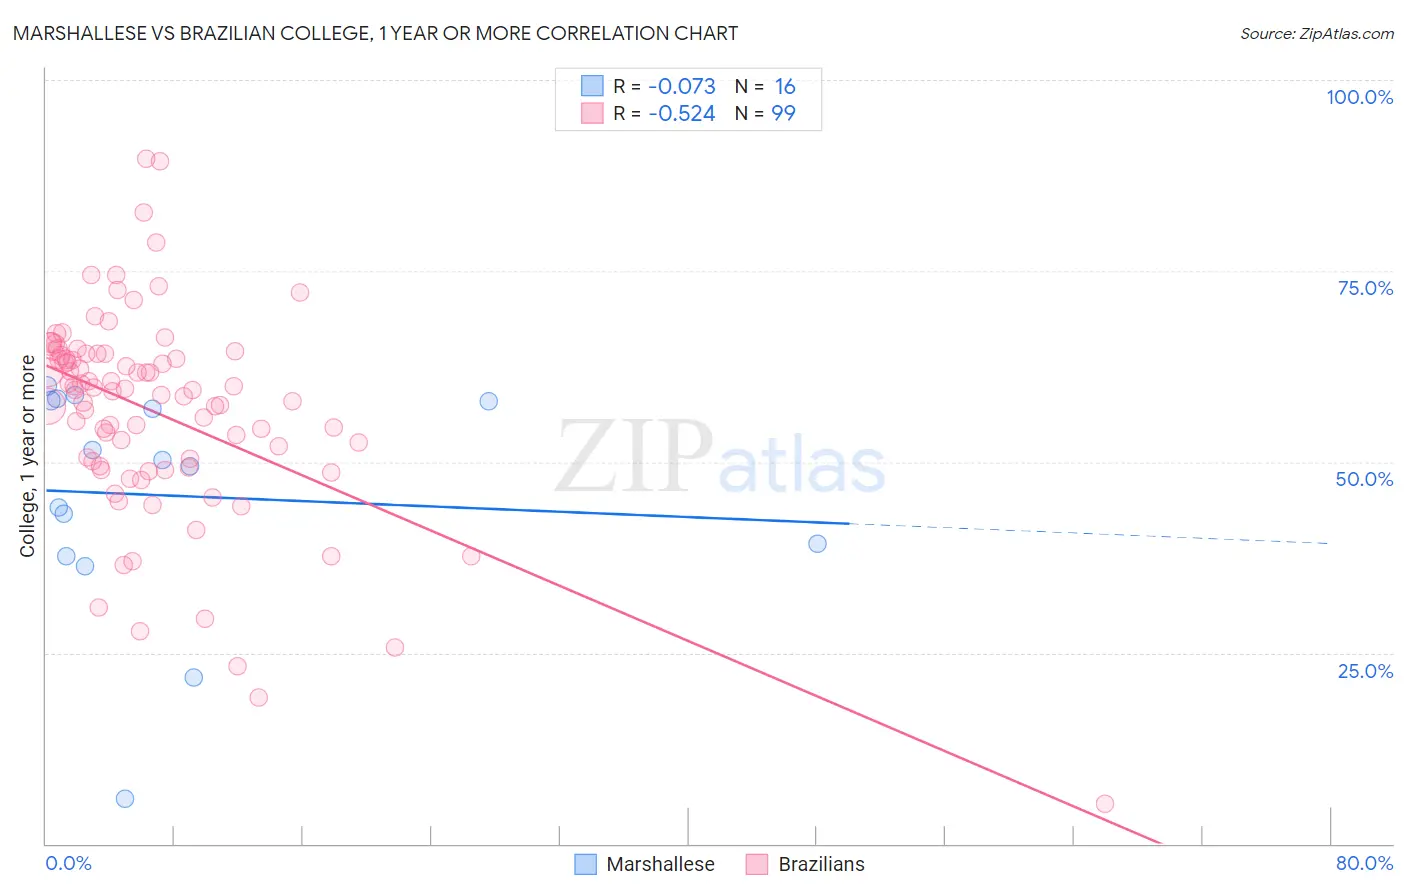
Marshallese vs Brazilian College, 1 year or more Correlation Chart

The statistical analysis conducted on geographies consisting of 14,761,315 people shows a slight negative correlation between the proportion of Marshallese and percentage of population with at least college, 1 year or more education in the United States with a correlation coefficient (R) of -0.073 and weighted average of 55.8%. Similarly, the statistical analysis conducted on geographies consisting of 323,962,626 people shows a substantial negative correlation between the proportion of Brazilians and percentage of population with at least college, 1 year or more education in the United States with a correlation coefficient (R) of -0.524 and weighted average of 60.5%, a difference of 8.4%.
Marshallese vs Brazilian College, 1 year or more

College, 1 year or more Correlation Summary

MeasurementMarshalleseBrazilian
Minimum5.9%5.3%
Maximum60.0%89.6%
Range54.1%84.3%
Mean45.6%56.5%
Median49.9%59.4%
Interquartile 25% (IQ1)38.5%49.4%
Interquartile 75% (IQ3)58.0%64.1%
Interquartile Range (IQR)19.5%14.7%
Standard Deviation (Sample)15.0%13.7%
Standard Deviation (Population)14.6%13.6%

Similar Demographics by College, 1 year or more

Demographics Similar to Marshallese by College, 1 year or more

In terms of college, 1 year or more, the demographic groups most similar to Marshallese are Osage (55.8%, a difference of 0.010%), French American Indian (55.8%, a difference of 0.11%), Chippewa (55.7%, a difference of 0.13%), Trinidadian and Tobagonian (55.8%, a difference of 0.15%), and Immigrants from Liberia (55.7%, a difference of 0.20%).
DemographicsRating | RankCollege, 1 year or more
West Indians
1.8
/100
|
#235
Tragic
56.3%
Iroquois
1.7
/100
|
#236
Tragic
56.2%
Samoans
1.6
/100
|
#237
Tragic
56.2%
Barbadians
1.3
/100
|
#238
Tragic
56.0%
Puget Sound Salish
1.1
/100
|
#239
Tragic
55.9%
Trinidadians and Tobagonians
1.1
/100
|
#240
Tragic
55.8%
French American Indians
1.0
/100
|
#241
Tragic
55.8%
Marshallese
1.0
/100
|
#242
Tragic
55.8%
Osage
1.0
/100
|
#243
Tragic
55.8%
Chippewa
0.9
/100
|
#244
Tragic
55.7%
Immigrants | Liberia
0.8
/100
|
#245
Tragic
55.7%
Malaysians
0.8
/100
|
#246
Tragic
55.6%
Hawaiians
0.8
/100
|
#247
Tragic
55.6%
Immigrants | Congo
0.8
/100
|
#248
Tragic
55.6%
Immigrants | Trinidad and Tobago
0.7
/100
|
#249
Tragic
55.5%

Demographics Similar to Brazilians by College, 1 year or more

In terms of college, 1 year or more, the demographic groups most similar to Brazilians are Kenyan (60.5%, a difference of 0.0%), Immigrants from Kenya (60.5%, a difference of 0.010%), Immigrants from Sudan (60.4%, a difference of 0.090%), Albanian (60.4%, a difference of 0.090%), and Scottish (60.5%, a difference of 0.10%).
DemographicsRating | RankCollege, 1 year or more
Poles
82.8
/100
|
#142
Excellent
60.7%
Canadians
82.7
/100
|
#143
Excellent
60.6%
Czechs
81.9
/100
|
#144
Excellent
60.6%
Slavs
81.1
/100
|
#145
Excellent
60.6%
Scottish
80.2
/100
|
#146
Excellent
60.5%
Immigrants | Kenya
79.1
/100
|
#147
Good
60.5%
Kenyans
79.0
/100
|
#148
Good
60.5%
Brazilians
79.0
/100
|
#149
Good
60.5%
Immigrants | Sudan
77.8
/100
|
#150
Good
60.4%
Albanians
77.8
/100
|
#151
Good
60.4%
Immigrants | Germany
76.1
/100
|
#152
Good
60.3%
Sierra Leoneans
74.1
/100
|
#153
Good
60.2%
Sudanese
73.0
/100
|
#154
Good
60.2%
Moroccans
72.9
/100
|
#155
Good
60.2%
Finns
72.9
/100
|
#156
Good
60.2%