Lithuanian vs Afghan College, 1 year or more
COMPARE
Lithuanian
Afghan
College, 1 year or more
College, 1 year or more Comparison
Lithuanians
Afghans
62.9%
COLLEGE, 1 YEAR OR MORE
98.8/ 100
METRIC RATING
80th/ 347
METRIC RANK
62.0%
COLLEGE, 1 YEAR OR MORE
96.4/ 100
METRIC RATING
103rd/ 347
METRIC RANK
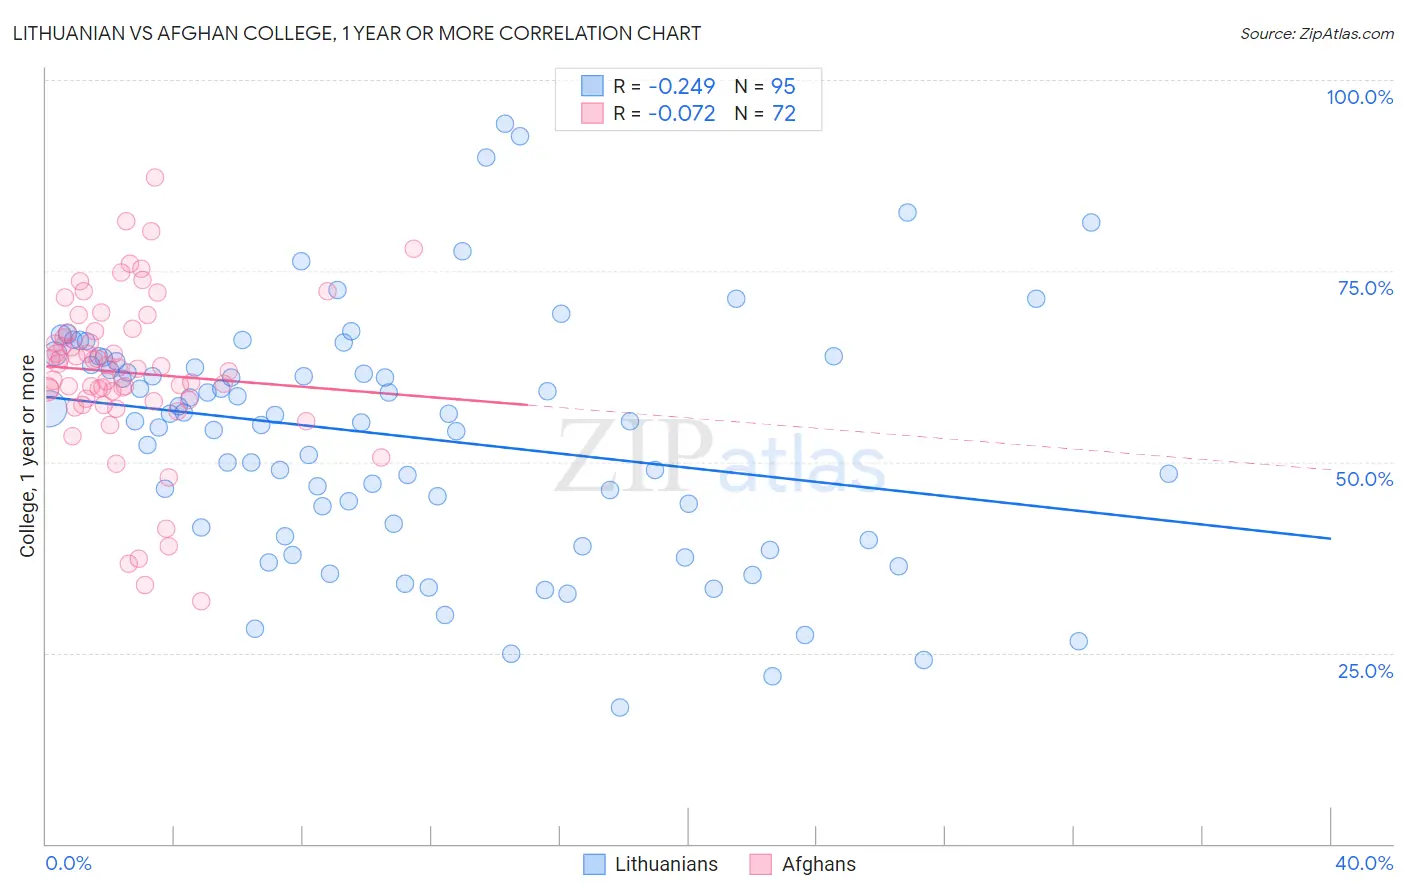
Lithuanian vs Afghan College, 1 year or more Correlation Chart
The statistical analysis conducted on geographies consisting of 421,945,677 people shows a weak negative correlation between the proportion of Lithuanians and percentage of population with at least college, 1 year or more education in the United States with a correlation coefficient (R) of -0.249 and weighted average of 62.9%. Similarly, the statistical analysis conducted on geographies consisting of 148,873,328 people shows a slight negative correlation between the proportion of Afghans and percentage of population with at least college, 1 year or more education in the United States with a correlation coefficient (R) of -0.072 and weighted average of 62.0%, a difference of 1.4%.
College, 1 year or more Correlation Summary
| Measurement | Lithuanian | Afghan |
| Minimum | 17.9% | 31.8% |
| Maximum | 94.2% | 87.2% |
| Range | 76.4% | 55.4% |
| Mean | 53.4% | 61.7% |
| Median | 55.4% | 62.3% |
| Interquartile 25% (IQ1) | 41.5% | 58.0% |
| Interquartile 75% (IQ3) | 63.2% | 67.0% |
| Interquartile Range (IQR) | 21.7% | 8.9% |
| Standard Deviation (Sample) | 15.7% | 10.6% |
| Standard Deviation (Population) | 15.7% | 10.5% |
Similar Demographics by College, 1 year or more
Demographics Similar to Lithuanians by College, 1 year or more
In terms of college, 1 year or more, the demographic groups most similar to Lithuanians are Northern European (62.9%, a difference of 0.040%), Immigrants from Lebanon (62.9%, a difference of 0.050%), Laotian (62.8%, a difference of 0.060%), Paraguayan (62.9%, a difference of 0.070%), and Ethiopian (62.9%, a difference of 0.070%).
| Demographics | Rating | Rank | College, 1 year or more |
| Immigrants | Moldova | 99.0 /100 | #73 | Exceptional 63.0% |
| Immigrants | North America | 99.0 /100 | #74 | Exceptional 63.0% |
| Armenians | 98.9 /100 | #75 | Exceptional 63.0% |
| Paraguayans | 98.8 /100 | #76 | Exceptional 62.9% |
| Ethiopians | 98.8 /100 | #77 | Exceptional 62.9% |
| Immigrants | Lebanon | 98.8 /100 | #78 | Exceptional 62.9% |
| Northern Europeans | 98.8 /100 | #79 | Exceptional 62.9% |
| Lithuanians | 98.8 /100 | #80 | Exceptional 62.9% |
| Laotians | 98.7 /100 | #81 | Exceptional 62.8% |
| Immigrants | Bolivia | 98.7 /100 | #82 | Exceptional 62.8% |
| Immigrants | Argentina | 98.6 /100 | #83 | Exceptional 62.8% |
| Immigrants | England | 98.6 /100 | #84 | Exceptional 62.8% |
| Immigrants | Pakistan | 98.6 /100 | #85 | Exceptional 62.8% |
| Immigrants | Western Europe | 98.6 /100 | #86 | Exceptional 62.7% |
| Immigrants | Hungary | 98.6 /100 | #87 | Exceptional 62.7% |
Demographics Similar to Afghans by College, 1 year or more
In terms of college, 1 year or more, the demographic groups most similar to Afghans are Chilean (62.0%, a difference of 0.010%), Immigrants from Nepal (62.0%, a difference of 0.030%), Palestinian (62.0%, a difference of 0.030%), Luxembourger (62.1%, a difference of 0.12%), and Icelander (62.1%, a difference of 0.13%).
| Demographics | Rating | Rank | College, 1 year or more |
| Chinese | 97.2 /100 | #96 | Exceptional 62.2% |
| Jordanians | 97.2 /100 | #97 | Exceptional 62.2% |
| Carpatho Rusyns | 97.2 /100 | #98 | Exceptional 62.2% |
| Croatians | 97.1 /100 | #99 | Exceptional 62.2% |
| Icelanders | 96.8 /100 | #100 | Exceptional 62.1% |
| Swedes | 96.8 /100 | #101 | Exceptional 62.1% |
| Luxembourgers | 96.7 /100 | #102 | Exceptional 62.1% |
| Afghans | 96.4 /100 | #103 | Exceptional 62.0% |
| Chileans | 96.4 /100 | #104 | Exceptional 62.0% |
| Immigrants | Nepal | 96.3 /100 | #105 | Exceptional 62.0% |
| Palestinians | 96.3 /100 | #106 | Exceptional 62.0% |
| Immigrants | Ukraine | 95.8 /100 | #107 | Exceptional 61.9% |
| Syrians | 95.7 /100 | #108 | Exceptional 61.9% |
| Immigrants | Northern Africa | 95.7 /100 | #109 | Exceptional 61.9% |
| Europeans | 95.6 /100 | #110 | Exceptional 61.8% |