Lithuanian vs Immigrants from Vietnam College, 1 year or more
COMPARE
Lithuanian
Immigrants from Vietnam
College, 1 year or more
College, 1 year or more Comparison
Lithuanians
Immigrants from Vietnam
62.9%
COLLEGE, 1 YEAR OR MORE
98.8/ 100
METRIC RATING
80th/ 347
METRIC RANK
58.2%
COLLEGE, 1 YEAR OR MORE
18.2/ 100
METRIC RATING
206th/ 347
METRIC RANK
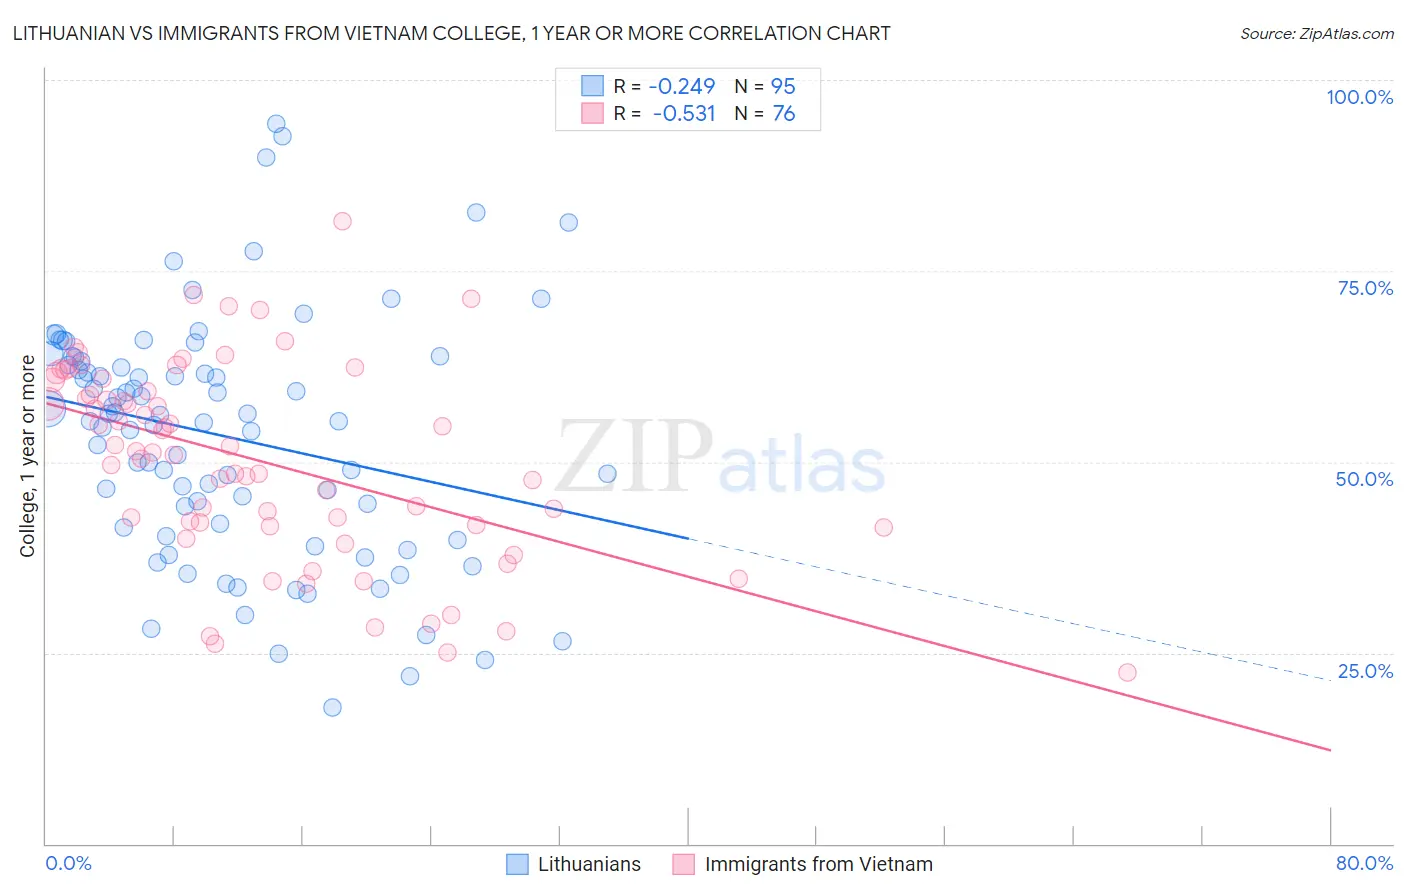
Lithuanian vs Immigrants from Vietnam College, 1 year or more Correlation Chart
The statistical analysis conducted on geographies consisting of 421,945,677 people shows a weak negative correlation between the proportion of Lithuanians and percentage of population with at least college, 1 year or more education in the United States with a correlation coefficient (R) of -0.249 and weighted average of 62.9%. Similarly, the statistical analysis conducted on geographies consisting of 404,840,629 people shows a substantial negative correlation between the proportion of Immigrants from Vietnam and percentage of population with at least college, 1 year or more education in the United States with a correlation coefficient (R) of -0.531 and weighted average of 58.2%, a difference of 8.0%.
College, 1 year or more Correlation Summary
| Measurement | Lithuanian | Immigrants from Vietnam |
| Minimum | 17.9% | 22.4% |
| Maximum | 94.2% | 81.5% |
| Range | 76.4% | 59.1% |
| Mean | 53.4% | 50.1% |
| Median | 55.4% | 51.3% |
| Interquartile 25% (IQ1) | 41.5% | 41.6% |
| Interquartile 75% (IQ3) | 63.2% | 60.0% |
| Interquartile Range (IQR) | 21.7% | 18.4% |
| Standard Deviation (Sample) | 15.7% | 12.9% |
| Standard Deviation (Population) | 15.7% | 12.8% |
Similar Demographics by College, 1 year or more
Demographics Similar to Lithuanians by College, 1 year or more
In terms of college, 1 year or more, the demographic groups most similar to Lithuanians are Northern European (62.9%, a difference of 0.040%), Immigrants from Lebanon (62.9%, a difference of 0.050%), Laotian (62.8%, a difference of 0.060%), Paraguayan (62.9%, a difference of 0.070%), and Ethiopian (62.9%, a difference of 0.070%).
| Demographics | Rating | Rank | College, 1 year or more |
| Immigrants | Moldova | 99.0 /100 | #73 | Exceptional 63.0% |
| Immigrants | North America | 99.0 /100 | #74 | Exceptional 63.0% |
| Armenians | 98.9 /100 | #75 | Exceptional 63.0% |
| Paraguayans | 98.8 /100 | #76 | Exceptional 62.9% |
| Ethiopians | 98.8 /100 | #77 | Exceptional 62.9% |
| Immigrants | Lebanon | 98.8 /100 | #78 | Exceptional 62.9% |
| Northern Europeans | 98.8 /100 | #79 | Exceptional 62.9% |
| Lithuanians | 98.8 /100 | #80 | Exceptional 62.9% |
| Laotians | 98.7 /100 | #81 | Exceptional 62.8% |
| Immigrants | Bolivia | 98.7 /100 | #82 | Exceptional 62.8% |
| Immigrants | Argentina | 98.6 /100 | #83 | Exceptional 62.8% |
| Immigrants | England | 98.6 /100 | #84 | Exceptional 62.8% |
| Immigrants | Pakistan | 98.6 /100 | #85 | Exceptional 62.8% |
| Immigrants | Western Europe | 98.6 /100 | #86 | Exceptional 62.7% |
| Immigrants | Hungary | 98.6 /100 | #87 | Exceptional 62.7% |
Demographics Similar to Immigrants from Vietnam by College, 1 year or more
In terms of college, 1 year or more, the demographic groups most similar to Immigrants from Vietnam are Immigrants from Zaire (58.3%, a difference of 0.040%), Panamanian (58.3%, a difference of 0.090%), Senegalese (58.2%, a difference of 0.12%), Ghanaian (58.4%, a difference of 0.23%), and Immigrants from Uruguay (58.1%, a difference of 0.29%).
| Demographics | Rating | Rank | College, 1 year or more |
| Slovaks | 24.6 /100 | #199 | Fair 58.5% |
| Spanish | 24.2 /100 | #200 | Fair 58.5% |
| Nigerians | 23.0 /100 | #201 | Fair 58.5% |
| Immigrants | South America | 21.9 /100 | #202 | Fair 58.4% |
| Ghanaians | 20.9 /100 | #203 | Fair 58.4% |
| Panamanians | 19.2 /100 | #204 | Poor 58.3% |
| Immigrants | Zaire | 18.7 /100 | #205 | Poor 58.3% |
| Immigrants | Vietnam | 18.2 /100 | #206 | Poor 58.2% |
| Senegalese | 16.9 /100 | #207 | Poor 58.2% |
| Immigrants | Uruguay | 15.2 /100 | #208 | Poor 58.1% |
| Immigrants | Middle Africa | 14.0 /100 | #209 | Poor 58.0% |
| Tsimshian | 13.5 /100 | #210 | Poor 57.9% |
| Immigrants | Nigeria | 13.3 /100 | #211 | Poor 57.9% |
| Immigrants | Senegal | 11.8 /100 | #212 | Poor 57.8% |
| French Canadians | 11.8 /100 | #213 | Poor 57.8% |