Lebanese vs Thai College, Under 1 year

COMPARE

Lebanese
Race
Ancestry
AfghanAfricanAlaska NativeAlaskan AthabascanAlbanianAleutAlsatianAmericanApacheArabArapahoArgentineanArmenianAssyrian/Chaldean/SyriacAustralianAustrianBahamianBangladeshiBarbadianBasqueBelgianBelizeanBermudanBhutaneseBlackfeetBolivianBrazilianBritishBritish West IndianBulgarianBurmeseCajunCambodianCanadianCape VerdeanCarpatho RusynCelticCentral AmericanCentral American IndianCherokeeCheyenneChickasawChileanChineseChippewaChoctawColombianColvilleComancheCosta RicanCreeCreekCroatianCrowCubanCypriotCzechCzechoslovakianDanishDelawareDominicanDutchDutch West IndianEastern EuropeanEcuadorianEgyptianEnglishEstonianEthiopianEuropeanFijianFilipinoFinnishFrenchFrench American IndianFrench CanadianGermanGerman RussianGhanaianGreekGuamanian/ChamorroGuatemalanGuyaneseHaitianHmongHonduranHopiHoumaHungarianIcelanderIndian (Asian)IndonesianInupiatIranianIraqiIrishIroquoisIsraeliItalianJamaicanJapaneseJordanianKenyanKiowaKoreanLaotianLatvianLebaneseLiberianLithuanianLumbeeLuxembourgerMacedonianMalaysianMalteseMarshalleseMenomineeMexicanMexican American IndianMongolianMoroccanNative HawaiianNavajoNepaleseNew ZealanderNicaraguanNigerianNorthern EuropeanNorwegianOkinawanOsageOttawaPaiutePakistaniPalestinianPanamanianParaguayanPennsylvania GermanPeruvianPimaPolishPortuguesePotawatomiPuebloPuerto RicanPuget Sound SalishRomanianRussianSalvadoranSamoanScandinavianScotch-IrishScottishSeminoleSenegaleseSerbianShoshoneSierra LeoneanSiouxSlavicSlovakSloveneSomaliSouth AfricanSouth AmericanSouth American IndianSoviet UnionSpaniardSpanishSpanish AmericanSpanish American IndianSri LankanSubsaharan AfricanSudaneseSwedishSwissSyrianTaiwaneseTlingit-HaidaTohono O'OdhamTonganTrinidadian and TobagonianTsimshianTurkishU.S. Virgin IslanderUgandanUkrainianUruguayanUteVenezuelanVietnameseWelshWest IndianYakamaYaquiYugoslavianYumanYup'ikZimbabwean
Immigration
NonimmigrantsImmigrantsAfghanistanAfricaAlbaniaArgentinaArmeniaAsiaAustraliaAustriaBahamasBangladeshBarbadosBelarusBelgiumBelizeBoliviaBosnia and HerzegovinaBrazilBulgariaBurma/MyanmarCabo VerdeCambodiaCameroonCanadaCaribbeanCentral AmericaChileChinaColombiaCongoCosta RicaCroatiaCubaCzechoslovakiaDenmarkDominicaDominican RepublicEastern AfricaEastern AsiaEastern EuropeEcuadorEgyptEl SalvadorEnglandEritreaEthiopiaEuropeFijiFranceGermanyGhanaGreeceGrenadaGuatemalaGuyanaHaitiHondurasHong KongHungaryIndiaIndonesiaIranIraqIrelandIsraelItalyJamaicaJapanJordanKazakhstanKenyaKoreaKuwaitLaosLatin AmericaLatviaLebanonLiberiaLithuaniaMalaysiaMexicoMicronesiaMiddle AfricaMoldovaMoroccoNepalNetherlandsNicaraguaNigeriaNorth AmericaNorth MacedoniaNorthern AfricaNorthern EuropeNorwayOceaniaPakistanPanamaPeruPhilippinesPolandPortugalRomaniaRussiaSaudi ArabiaScotlandSenegalSerbiaSierra LeoneSingaporeSomaliaSouth AfricaSouth AmericaSouth Central AsiaSouth Eastern AsiaSouthern EuropeSpainSri LankaSt. Vincent and the GrenadinesSudanSwedenSwitzerlandSyriaTaiwanThailandTrinidad and TobagoTurkeyUgandaUkraineUruguayUzbekistanVenezuelaVietnamWest IndiesWestern AfricaWestern AsiaWestern EuropeYemenZaireZimbabweAzores
Thai
Race
Ancestry
AfghanAfricanAlaska NativeAlaskan AthabascanAlbanianAleutAlsatianAmericanApacheArabArapahoArgentineanArmenianAssyrian/Chaldean/SyriacAustralianAustrianBahamianBangladeshiBarbadianBasqueBelgianBelizeanBermudanBhutaneseBlackfeetBolivianBrazilianBritishBritish West IndianBulgarianBurmeseCajunCambodianCanadianCape VerdeanCarpatho RusynCelticCentral AmericanCentral American IndianCherokeeCheyenneChickasawChileanChineseChippewaChoctawColombianColvilleComancheCosta RicanCreeCreekCroatianCrowCubanCypriotCzechCzechoslovakianDanishDelawareDominicanDutchDutch West IndianEastern EuropeanEcuadorianEgyptianEnglishEstonianEthiopianEuropeanFijianFilipinoFinnishFrenchFrench American IndianFrench CanadianGermanGerman RussianGhanaianGreekGuamanian/ChamorroGuatemalanGuyaneseHaitianHmongHonduranHopiHoumaHungarianIcelanderIndian (Asian)IndonesianInupiatIranianIraqiIrishIroquoisIsraeliItalianJamaicanJapaneseJordanianKenyanKiowaKoreanLaotianLatvianLiberianLithuanianLumbeeLuxembourgerMacedonianMalaysianMalteseMarshalleseMenomineeMexicanMexican American IndianMongolianMoroccanNative HawaiianNavajoNepaleseNew ZealanderNicaraguanNigerianNorthern EuropeanNorwegianOkinawanOsageOttawaPaiutePakistaniPalestinianPanamanianParaguayanPennsylvania GermanPeruvianPimaPolishPortuguesePotawatomiPuebloPuerto RicanPuget Sound SalishRomanianRussianSalvadoranSamoanScandinavianScotch-IrishScottishSeminoleSenegaleseSerbianShoshoneSierra LeoneanSiouxSlavicSlovakSloveneSomaliSouth AfricanSouth AmericanSouth American IndianSoviet UnionSpaniardSpanishSpanish AmericanSpanish American IndianSri LankanSubsaharan AfricanSudaneseSwedishSwissSyrianTaiwaneseThaiTlingit-HaidaTohono O'OdhamTonganTrinidadian and TobagonianTsimshianTurkishU.S. Virgin IslanderUgandanUkrainianUruguayanUteVenezuelanVietnameseWelshWest IndianYakamaYaquiYugoslavianYumanYup'ikZimbabwean
Immigration
NonimmigrantsImmigrantsAfghanistanAfricaAlbaniaArgentinaArmeniaAsiaAustraliaAustriaBahamasBangladeshBarbadosBelarusBelgiumBelizeBoliviaBosnia and HerzegovinaBrazilBulgariaBurma/MyanmarCabo VerdeCambodiaCameroonCanadaCaribbeanCentral AmericaChileChinaColombiaCongoCosta RicaCroatiaCubaCzechoslovakiaDenmarkDominicaDominican RepublicEastern AfricaEastern AsiaEastern EuropeEcuadorEgyptEl SalvadorEnglandEritreaEthiopiaEuropeFijiFranceGermanyGhanaGreeceGrenadaGuatemalaGuyanaHaitiHondurasHong KongHungaryIndiaIndonesiaIranIraqIrelandIsraelItalyJamaicaJapanJordanKazakhstanKenyaKoreaKuwaitLaosLatin AmericaLatviaLebanonLiberiaLithuaniaMalaysiaMexicoMicronesiaMiddle AfricaMoldovaMoroccoNepalNetherlandsNicaraguaNigeriaNorth AmericaNorth MacedoniaNorthern AfricaNorthern EuropeNorwayOceaniaPakistanPanamaPeruPhilippinesPolandPortugalRomaniaRussiaSaudi ArabiaScotlandSenegalSerbiaSierra LeoneSingaporeSomaliaSouth AfricaSouth AmericaSouth Central AsiaSouth Eastern AsiaSouthern EuropeSpainSri LankaSt. Vincent and the GrenadinesSudanSwedenSwitzerlandSyriaTaiwanThailandTrinidad and TobagoTurkeyUgandaUkraineUruguayUzbekistanVenezuelaVietnamWest IndiesWestern AfricaWestern AsiaWestern EuropeYemenZaireZimbabweAzores
College, Under 1 year
Income
Poverty
Unemployment
Labor Participation
Family Structure
Vehicle Availability
Education Level
Disability

College, Under 1 year Comparison

Lebanese

Thais

Exceptional
Exceptional
67.5%
COLLEGE, UNDER 1 YEAR
94.6/ 100
METRIC RATING
119th/ 347
METRIC RANK
73.4%
COLLEGE, UNDER 1 YEAR
100.0/ 100
METRIC RATING
8th/ 347
METRIC RANK

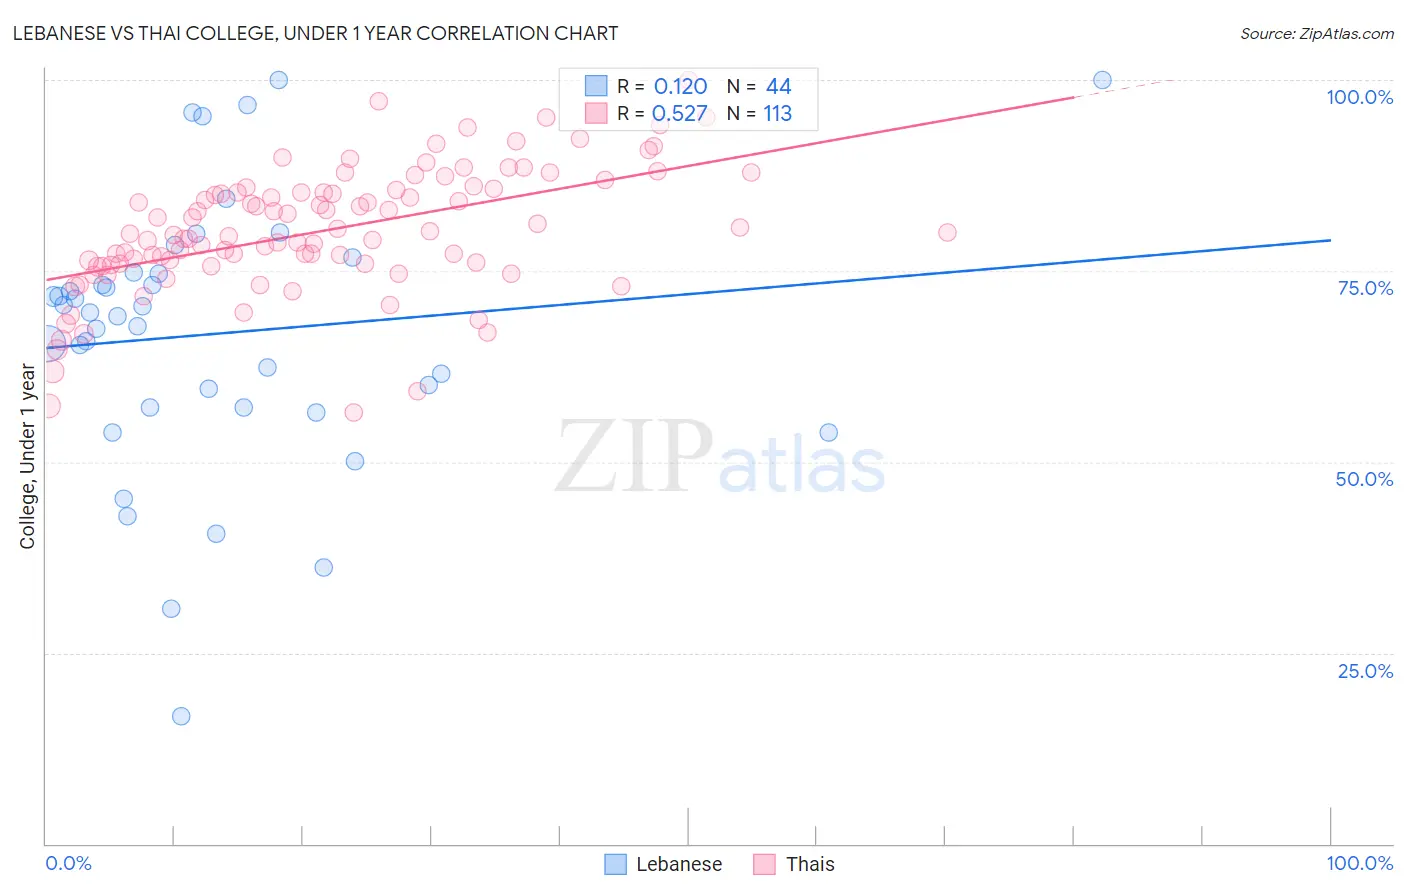
Lebanese vs Thai College, Under 1 year Correlation Chart

The statistical analysis conducted on geographies consisting of 401,622,274 people shows a poor positive correlation between the proportion of Lebanese and percentage of population with at least college, under 1 year education in the United States with a correlation coefficient (R) of 0.120 and weighted average of 67.5%. Similarly, the statistical analysis conducted on geographies consisting of 475,810,175 people shows a substantial positive correlation between the proportion of Thais and percentage of population with at least college, under 1 year education in the United States with a correlation coefficient (R) of 0.527 and weighted average of 73.4%, a difference of 8.8%.
Lebanese vs Thai College, Under 1 year

College, Under 1 year Correlation Summary

MeasurementLebaneseThai
Minimum16.6%56.5%
Maximum100.0%100.0%
Range83.4%43.5%
Mean66.8%80.3%
Median69.3%79.9%
Interquartile 25% (IQ1)57.1%75.8%
Interquartile 75% (IQ3)74.7%85.5%
Interquartile Range (IQR)17.6%9.6%
Standard Deviation (Sample)17.8%8.2%
Standard Deviation (Population)17.6%8.2%

Similar Demographics by College, Under 1 year

Demographics Similar to Lebanese by College, Under 1 year

In terms of college, under 1 year, the demographic groups most similar to Lebanese are Immigrants from Ukraine (67.5%, a difference of 0.010%), Pakistani (67.5%, a difference of 0.040%), Immigrants from Nepal (67.5%, a difference of 0.060%), Basque (67.6%, a difference of 0.14%), and Chilean (67.6%, a difference of 0.15%).
DemographicsRating | RankCollege, Under 1 year
Macedonians
95.7
/100
|
#112
Exceptional
67.6%
Syrians
95.6
/100
|
#113
Exceptional
67.6%
Chileans
95.3
/100
|
#114
Exceptional
67.6%
Basques
95.2
/100
|
#115
Exceptional
67.6%
Immigrants | Nepal
94.9
/100
|
#116
Exceptional
67.5%
Pakistanis
94.8
/100
|
#117
Exceptional
67.5%
Immigrants | Ukraine
94.7
/100
|
#118
Exceptional
67.5%
Lebanese
94.6
/100
|
#119
Exceptional
67.5%
Serbians
93.9
/100
|
#120
Exceptional
67.4%
Slovenes
93.3
/100
|
#121
Exceptional
67.3%
Immigrants | Jordan
92.8
/100
|
#122
Exceptional
67.3%
Immigrants | Northern Africa
92.7
/100
|
#123
Exceptional
67.2%
Arabs
92.6
/100
|
#124
Exceptional
67.2%
Italians
91.8
/100
|
#125
Exceptional
67.2%
Alsatians
91.3
/100
|
#126
Exceptional
67.1%

Demographics Similar to Thais by College, Under 1 year

In terms of college, under 1 year, the demographic groups most similar to Thais are Okinawan (73.7%, a difference of 0.33%), Immigrants from Australia (72.7%, a difference of 0.95%), Immigrants from Taiwan (74.2%, a difference of 1.0%), Immigrants from Iran (74.3%, a difference of 1.1%), and Immigrants from India (74.4%, a difference of 1.4%).
DemographicsRating | RankCollege, Under 1 year
Filipinos
100.0
/100
|
#1
Exceptional
75.5%
Iranians
100.0
/100
|
#2
Exceptional
74.9%
Immigrants | Singapore
100.0
/100
|
#3
Exceptional
74.8%
Immigrants | India
100.0
/100
|
#4
Exceptional
74.4%
Immigrants | Iran
100.0
/100
|
#5
Exceptional
74.3%
Immigrants | Taiwan
100.0
/100
|
#6
Exceptional
74.2%
Okinawans
100.0
/100
|
#7
Exceptional
73.7%
Thais
100.0
/100
|
#8
Exceptional
73.4%
Immigrants | Australia
100.0
/100
|
#9
Exceptional
72.7%
Immigrants | Israel
100.0
/100
|
#10
Exceptional
72.3%
Immigrants | South Central Asia
100.0
/100
|
#11
Exceptional
72.1%
Immigrants | Sweden
100.0
/100
|
#12
Exceptional
72.1%
Cypriots
100.0
/100
|
#13
Exceptional
72.0%
Cambodians
100.0
/100
|
#14
Exceptional
71.9%
Burmese
100.0
/100
|
#15
Exceptional
71.9%