Immigrants from Uruguay vs Immigrants from Armenia College, Under 1 year

COMPARE

Immigrants from Uruguay
Race
Ancestry
AfghanAfricanAlaska NativeAlaskan AthabascanAlbanianAleutAlsatianAmericanApacheArabArapahoArgentineanArmenianAssyrian/Chaldean/SyriacAustralianAustrianBahamianBangladeshiBarbadianBasqueBelgianBelizeanBermudanBhutaneseBlackfeetBolivianBrazilianBritishBritish West IndianBulgarianBurmeseCajunCambodianCanadianCape VerdeanCarpatho RusynCelticCentral AmericanCentral American IndianCherokeeCheyenneChickasawChileanChineseChippewaChoctawColombianColvilleComancheCosta RicanCreeCreekCroatianCrowCubanCypriotCzechCzechoslovakianDanishDelawareDominicanDutchDutch West IndianEastern EuropeanEcuadorianEgyptianEnglishEstonianEthiopianEuropeanFijianFilipinoFinnishFrenchFrench American IndianFrench CanadianGermanGerman RussianGhanaianGreekGuamanian/ChamorroGuatemalanGuyaneseHaitianHmongHonduranHopiHoumaHungarianIcelanderIndian (Asian)IndonesianInupiatIranianIraqiIrishIroquoisIsraeliItalianJamaicanJapaneseJordanianKenyanKiowaKoreanLaotianLatvianLebaneseLiberianLithuanianLumbeeLuxembourgerMacedonianMalaysianMalteseMarshalleseMenomineeMexicanMexican American IndianMongolianMoroccanNative HawaiianNavajoNepaleseNew ZealanderNicaraguanNigerianNorthern EuropeanNorwegianOkinawanOsageOttawaPaiutePakistaniPalestinianPanamanianParaguayanPennsylvania GermanPeruvianPimaPolishPortuguesePotawatomiPuebloPuerto RicanPuget Sound SalishRomanianRussianSalvadoranSamoanScandinavianScotch-IrishScottishSeminoleSenegaleseSerbianShoshoneSierra LeoneanSiouxSlavicSlovakSloveneSomaliSouth AfricanSouth AmericanSouth American IndianSoviet UnionSpaniardSpanishSpanish AmericanSpanish American IndianSri LankanSubsaharan AfricanSudaneseSwedishSwissSyrianTaiwaneseThaiTlingit-HaidaTohono O'OdhamTonganTrinidadian and TobagonianTsimshianTurkishU.S. Virgin IslanderUgandanUkrainianUruguayanUteVenezuelanVietnameseWelshWest IndianYakamaYaquiYugoslavianYumanYup'ikZimbabwean
Immigration
NonimmigrantsImmigrantsAfghanistanAfricaAlbaniaArgentinaAsiaAustraliaAustriaBahamasBangladeshBarbadosBelarusBelgiumBelizeBoliviaBosnia and HerzegovinaBrazilBulgariaBurma/MyanmarCabo VerdeCambodiaCameroonCanadaCaribbeanCentral AmericaChileChinaColombiaCongoCosta RicaCroatiaCubaCzechoslovakiaDenmarkDominicaDominican RepublicEastern AfricaEastern AsiaEastern EuropeEcuadorEgyptEl SalvadorEnglandEritreaEthiopiaEuropeFijiFranceGermanyGhanaGreeceGrenadaGuatemalaGuyanaHaitiHondurasHong KongHungaryIndiaIndonesiaIranIraqIrelandIsraelItalyJamaicaJapanJordanKazakhstanKenyaKoreaKuwaitLaosLatin AmericaLatviaLebanonLiberiaLithuaniaMalaysiaMexicoMicronesiaMiddle AfricaMoldovaMoroccoNepalNetherlandsNicaraguaNigeriaNorth AmericaNorth MacedoniaNorthern AfricaNorthern EuropeNorwayOceaniaPakistanPanamaPeruPhilippinesPolandPortugalRomaniaRussiaSaudi ArabiaScotlandSenegalSerbiaSierra LeoneSingaporeSomaliaSouth AfricaSouth AmericaSouth Central AsiaSouth Eastern AsiaSouthern EuropeSpainSri LankaSt. Vincent and the GrenadinesSudanSwedenSwitzerlandSyriaTaiwanThailandTrinidad and TobagoTurkeyUgandaUkraineUruguayUzbekistanVenezuelaVietnamWest IndiesWestern AfricaWestern AsiaWestern EuropeYemenZaireZimbabweAzores
Immigrants from Armenia
Race
Ancestry
AfghanAfricanAlaska NativeAlaskan AthabascanAlbanianAleutAlsatianAmericanApacheArabArapahoArgentineanArmenianAssyrian/Chaldean/SyriacAustralianAustrianBahamianBangladeshiBarbadianBasqueBelgianBelizeanBermudanBhutaneseBlackfeetBolivianBrazilianBritishBritish West IndianBulgarianBurmeseCajunCambodianCanadianCape VerdeanCarpatho RusynCelticCentral AmericanCentral American IndianCherokeeCheyenneChickasawChileanChineseChippewaChoctawColombianColvilleComancheCosta RicanCreeCreekCroatianCrowCubanCypriotCzechCzechoslovakianDanishDelawareDominicanDutchDutch West IndianEastern EuropeanEcuadorianEgyptianEnglishEstonianEthiopianEuropeanFijianFilipinoFinnishFrenchFrench American IndianFrench CanadianGermanGerman RussianGhanaianGreekGuamanian/ChamorroGuatemalanGuyaneseHaitianHmongHonduranHopiHoumaHungarianIcelanderIndian (Asian)IndonesianInupiatIranianIraqiIrishIroquoisIsraeliItalianJamaicanJapaneseJordanianKenyanKiowaKoreanLaotianLatvianLebaneseLiberianLithuanianLumbeeLuxembourgerMacedonianMalaysianMalteseMarshalleseMenomineeMexicanMexican American IndianMongolianMoroccanNative HawaiianNavajoNepaleseNew ZealanderNicaraguanNigerianNorthern EuropeanNorwegianOkinawanOsageOttawaPaiutePakistaniPalestinianPanamanianParaguayanPennsylvania GermanPeruvianPimaPolishPortuguesePotawatomiPuebloPuerto RicanPuget Sound SalishRomanianRussianSalvadoranSamoanScandinavianScotch-IrishScottishSeminoleSenegaleseSerbianShoshoneSierra LeoneanSiouxSlavicSlovakSloveneSomaliSouth AfricanSouth AmericanSouth American IndianSoviet UnionSpaniardSpanishSpanish AmericanSpanish American IndianSri LankanSubsaharan AfricanSudaneseSwedishSwissSyrianTaiwaneseThaiTlingit-HaidaTohono O'OdhamTonganTrinidadian and TobagonianTsimshianTurkishU.S. Virgin IslanderUgandanUkrainianUruguayanUteVenezuelanVietnameseWelshWest IndianYakamaYaquiYugoslavianYumanYup'ikZimbabwean
Immigration
NonimmigrantsImmigrantsAfghanistanAfricaAlbaniaArgentinaArmeniaAsiaAustraliaAustriaBahamasBangladeshBarbadosBelarusBelgiumBelizeBoliviaBosnia and HerzegovinaBrazilBulgariaBurma/MyanmarCabo VerdeCambodiaCameroonCanadaCaribbeanCentral AmericaChileChinaColombiaCongoCosta RicaCroatiaCubaCzechoslovakiaDenmarkDominicaDominican RepublicEastern AfricaEastern AsiaEastern EuropeEcuadorEgyptEl SalvadorEnglandEritreaEthiopiaEuropeFijiFranceGermanyGhanaGreeceGrenadaGuatemalaGuyanaHaitiHondurasHong KongHungaryIndiaIndonesiaIranIraqIrelandIsraelItalyJamaicaJapanJordanKazakhstanKenyaKoreaKuwaitLaosLatin AmericaLatviaLebanonLiberiaLithuaniaMalaysiaMexicoMicronesiaMiddle AfricaMoldovaMoroccoNepalNetherlandsNicaraguaNigeriaNorth AmericaNorth MacedoniaNorthern AfricaNorthern EuropeNorwayOceaniaPakistanPanamaPeruPhilippinesPolandPortugalRomaniaRussiaSaudi ArabiaScotlandSenegalSerbiaSierra LeoneSingaporeSomaliaSouth AfricaSouth AmericaSouth Central AsiaSouth Eastern AsiaSouthern EuropeSpainSri LankaSt. Vincent and the GrenadinesSudanSwedenSwitzerlandSyriaTaiwanThailandTrinidad and TobagoTurkeyUgandaUkraineUzbekistanVenezuelaVietnamWest IndiesWestern AfricaWestern AsiaWestern EuropeYemenZaireZimbabweAzores
College, Under 1 year
Income
Poverty
Unemployment
Labor Participation
Family Structure
Vehicle Availability
Education Level
Disability

College, Under 1 year Comparison

Immigrants from Uruguay

Immigrants from Armenia

Tragic
Fair
63.4%
COLLEGE, UNDER 1 YEAR
5.8/ 100
METRIC RATING
217th/ 347
METRIC RANK
64.7%
COLLEGE, UNDER 1 YEAR
28.1/ 100
METRIC RATING
191st/ 347
METRIC RANK

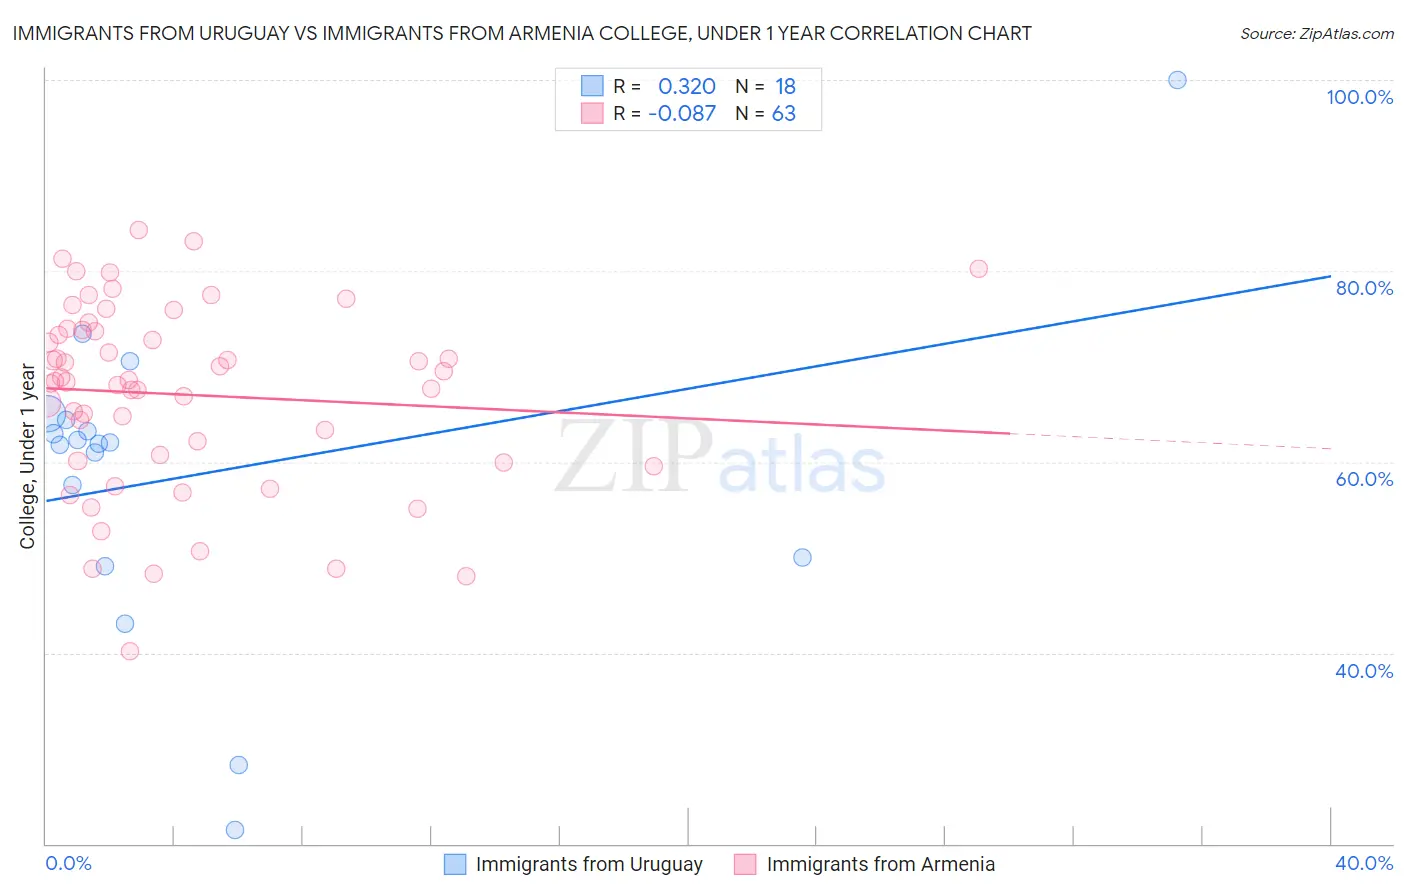
Immigrants from Uruguay vs Immigrants from Armenia College, Under 1 year Correlation Chart

The statistical analysis conducted on geographies consisting of 133,259,667 people shows a mild positive correlation between the proportion of Immigrants from Uruguay and percentage of population with at least college, under 1 year education in the United States with a correlation coefficient (R) of 0.320 and weighted average of 63.4%. Similarly, the statistical analysis conducted on geographies consisting of 97,725,183 people shows a slight negative correlation between the proportion of Immigrants from Armenia and percentage of population with at least college, under 1 year education in the United States with a correlation coefficient (R) of -0.087 and weighted average of 64.7%, a difference of 2.1%.
Immigrants from Uruguay vs Immigrants from Armenia College, Under 1 year

College, Under 1 year Correlation Summary

MeasurementImmigrants from UruguayImmigrants from Armenia
Minimum21.5%40.2%
Maximum100.0%84.3%
Range78.5%44.1%
Mean58.8%67.0%
Median62.0%68.4%
Interquartile 25% (IQ1)50.0%60.1%
Interquartile 75% (IQ3)64.4%73.8%
Interquartile Range (IQR)14.4%13.6%
Standard Deviation (Sample)17.1%9.7%
Standard Deviation (Population)16.6%9.7%

Similar Demographics by College, Under 1 year

Demographics Similar to Immigrants from Uruguay by College, Under 1 year

In terms of college, under 1 year, the demographic groups most similar to Immigrants from Uruguay are Immigrants from Panama (63.4%, a difference of 0.020%), Immigrants from Fiji (63.4%, a difference of 0.030%), Portuguese (63.4%, a difference of 0.050%), Cree (63.3%, a difference of 0.14%), and Hmong (63.5%, a difference of 0.19%).
DemographicsRating | RankCollege, Under 1 year
Ghanaians
11.2
/100
|
#210
Poor
63.9%
Native Hawaiians
10.6
/100
|
#211
Poor
63.9%
Immigrants | Middle Africa
10.5
/100
|
#212
Poor
63.9%
Immigrants | South America
9.1
/100
|
#213
Tragic
63.8%
Immigrants | Nigeria
8.8
/100
|
#214
Tragic
63.7%
Senegalese
7.7
/100
|
#215
Tragic
63.6%
Hmong
6.8
/100
|
#216
Tragic
63.5%
Immigrants | Uruguay
5.8
/100
|
#217
Tragic
63.4%
Immigrants | Panama
5.7
/100
|
#218
Tragic
63.4%
Immigrants | Fiji
5.7
/100
|
#219
Tragic
63.4%
Portuguese
5.6
/100
|
#220
Tragic
63.4%
Cree
5.2
/100
|
#221
Tragic
63.3%
Immigrants | Senegal
5.0
/100
|
#222
Tragic
63.3%
Immigrants | Costa Rica
4.5
/100
|
#223
Tragic
63.2%
Sub-Saharan Africans
4.4
/100
|
#224
Tragic
63.2%

Demographics Similar to Immigrants from Armenia by College, Under 1 year

In terms of college, under 1 year, the demographic groups most similar to Immigrants from Armenia are Immigrants from Thailand (64.7%, a difference of 0.060%), Slovak (64.7%, a difference of 0.070%), Immigrants from Philippines (64.8%, a difference of 0.11%), Spanish (64.9%, a difference of 0.19%), and Immigrants from Cameroon (64.6%, a difference of 0.20%).
DemographicsRating | RankCollege, Under 1 year
Bermudans
42.0
/100
|
#184
Average
65.2%
Sri Lankans
41.7
/100
|
#185
Average
65.2%
Immigrants | Sierra Leone
39.7
/100
|
#186
Fair
65.1%
Immigrants | Southern Europe
34.3
/100
|
#187
Fair
64.9%
Immigrants | Albania
32.0
/100
|
#188
Fair
64.9%
Spanish
31.6
/100
|
#189
Fair
64.9%
Immigrants | Philippines
30.1
/100
|
#190
Fair
64.8%
Immigrants | Armenia
28.1
/100
|
#191
Fair
64.7%
Immigrants | Thailand
27.0
/100
|
#192
Fair
64.7%
Slovaks
26.7
/100
|
#193
Fair
64.7%
Immigrants | Cameroon
24.6
/100
|
#194
Fair
64.6%
Immigrants | South Eastern Asia
22.1
/100
|
#195
Fair
64.5%
Tongans
21.2
/100
|
#196
Fair
64.5%
Costa Ricans
19.6
/100
|
#197
Poor
64.4%
Tsimshian
17.9
/100
|
#198
Poor
64.3%