Immigrants from Uruguay vs Immigrants from Korea College, Under 1 year

COMPARE

Immigrants from Uruguay
Race
Ancestry
AfghanAfricanAlaska NativeAlaskan AthabascanAlbanianAleutAlsatianAmericanApacheArabArapahoArgentineanArmenianAssyrian/Chaldean/SyriacAustralianAustrianBahamianBangladeshiBarbadianBasqueBelgianBelizeanBermudanBhutaneseBlackfeetBolivianBrazilianBritishBritish West IndianBulgarianBurmeseCajunCambodianCanadianCape VerdeanCarpatho RusynCelticCentral AmericanCentral American IndianCherokeeCheyenneChickasawChileanChineseChippewaChoctawColombianColvilleComancheCosta RicanCreeCreekCroatianCrowCubanCypriotCzechCzechoslovakianDanishDelawareDominicanDutchDutch West IndianEastern EuropeanEcuadorianEgyptianEnglishEstonianEthiopianEuropeanFijianFilipinoFinnishFrenchFrench American IndianFrench CanadianGermanGerman RussianGhanaianGreekGuamanian/ChamorroGuatemalanGuyaneseHaitianHmongHonduranHopiHoumaHungarianIcelanderIndian (Asian)IndonesianInupiatIranianIraqiIrishIroquoisIsraeliItalianJamaicanJapaneseJordanianKenyanKiowaKoreanLaotianLatvianLebaneseLiberianLithuanianLumbeeLuxembourgerMacedonianMalaysianMalteseMarshalleseMenomineeMexicanMexican American IndianMongolianMoroccanNative HawaiianNavajoNepaleseNew ZealanderNicaraguanNigerianNorthern EuropeanNorwegianOkinawanOsageOttawaPaiutePakistaniPalestinianPanamanianParaguayanPennsylvania GermanPeruvianPimaPolishPortuguesePotawatomiPuebloPuerto RicanPuget Sound SalishRomanianRussianSalvadoranSamoanScandinavianScotch-IrishScottishSeminoleSenegaleseSerbianShoshoneSierra LeoneanSiouxSlavicSlovakSloveneSomaliSouth AfricanSouth AmericanSouth American IndianSoviet UnionSpaniardSpanishSpanish AmericanSpanish American IndianSri LankanSubsaharan AfricanSudaneseSwedishSwissSyrianTaiwaneseThaiTlingit-HaidaTohono O'OdhamTonganTrinidadian and TobagonianTsimshianTurkishU.S. Virgin IslanderUgandanUkrainianUruguayanUteVenezuelanVietnameseWelshWest IndianYakamaYaquiYugoslavianYumanYup'ikZimbabwean
Immigration
NonimmigrantsImmigrantsAfghanistanAfricaAlbaniaArgentinaArmeniaAsiaAustraliaAustriaBahamasBangladeshBarbadosBelarusBelgiumBelizeBoliviaBosnia and HerzegovinaBrazilBulgariaBurma/MyanmarCabo VerdeCambodiaCameroonCanadaCaribbeanCentral AmericaChileChinaColombiaCongoCosta RicaCroatiaCubaCzechoslovakiaDenmarkDominicaDominican RepublicEastern AfricaEastern AsiaEastern EuropeEcuadorEgyptEl SalvadorEnglandEritreaEthiopiaEuropeFijiFranceGermanyGhanaGreeceGrenadaGuatemalaGuyanaHaitiHondurasHong KongHungaryIndiaIndonesiaIranIraqIrelandIsraelItalyJamaicaJapanJordanKazakhstanKenyaKuwaitLaosLatin AmericaLatviaLebanonLiberiaLithuaniaMalaysiaMexicoMicronesiaMiddle AfricaMoldovaMoroccoNepalNetherlandsNicaraguaNigeriaNorth AmericaNorth MacedoniaNorthern AfricaNorthern EuropeNorwayOceaniaPakistanPanamaPeruPhilippinesPolandPortugalRomaniaRussiaSaudi ArabiaScotlandSenegalSerbiaSierra LeoneSingaporeSomaliaSouth AfricaSouth AmericaSouth Central AsiaSouth Eastern AsiaSouthern EuropeSpainSri LankaSt. Vincent and the GrenadinesSudanSwedenSwitzerlandSyriaTaiwanThailandTrinidad and TobagoTurkeyUgandaUkraineUruguayUzbekistanVenezuelaVietnamWest IndiesWestern AfricaWestern AsiaWestern EuropeYemenZaireZimbabweAzores
Immigrants from Korea
Race
Ancestry
AfghanAfricanAlaska NativeAlaskan AthabascanAlbanianAleutAlsatianAmericanApacheArabArapahoArgentineanArmenianAssyrian/Chaldean/SyriacAustralianAustrianBahamianBangladeshiBarbadianBasqueBelgianBelizeanBermudanBhutaneseBlackfeetBolivianBrazilianBritishBritish West IndianBulgarianBurmeseCajunCambodianCanadianCape VerdeanCarpatho RusynCelticCentral AmericanCentral American IndianCherokeeCheyenneChickasawChileanChineseChippewaChoctawColombianColvilleComancheCosta RicanCreeCreekCroatianCrowCubanCypriotCzechCzechoslovakianDanishDelawareDominicanDutchDutch West IndianEastern EuropeanEcuadorianEgyptianEnglishEstonianEthiopianEuropeanFijianFilipinoFinnishFrenchFrench American IndianFrench CanadianGermanGerman RussianGhanaianGreekGuamanian/ChamorroGuatemalanGuyaneseHaitianHmongHonduranHopiHoumaHungarianIcelanderIndian (Asian)IndonesianInupiatIranianIraqiIrishIroquoisIsraeliItalianJamaicanJapaneseJordanianKenyanKiowaKoreanLaotianLatvianLebaneseLiberianLithuanianLumbeeLuxembourgerMacedonianMalaysianMalteseMarshalleseMenomineeMexicanMexican American IndianMongolianMoroccanNative HawaiianNavajoNepaleseNew ZealanderNicaraguanNigerianNorthern EuropeanNorwegianOkinawanOsageOttawaPaiutePakistaniPalestinianPanamanianParaguayanPennsylvania GermanPeruvianPimaPolishPortuguesePotawatomiPuebloPuerto RicanPuget Sound SalishRomanianRussianSalvadoranSamoanScandinavianScotch-IrishScottishSeminoleSenegaleseSerbianShoshoneSierra LeoneanSiouxSlavicSlovakSloveneSomaliSouth AfricanSouth AmericanSouth American IndianSoviet UnionSpaniardSpanishSpanish AmericanSpanish American IndianSri LankanSubsaharan AfricanSudaneseSwedishSwissSyrianTaiwaneseThaiTlingit-HaidaTohono O'OdhamTonganTrinidadian and TobagonianTsimshianTurkishU.S. Virgin IslanderUgandanUkrainianUruguayanUteVenezuelanVietnameseWelshWest IndianYakamaYaquiYugoslavianYumanYup'ikZimbabwean
Immigration
NonimmigrantsImmigrantsAfghanistanAfricaAlbaniaArgentinaArmeniaAsiaAustraliaAustriaBahamasBangladeshBarbadosBelarusBelgiumBelizeBoliviaBosnia and HerzegovinaBrazilBulgariaBurma/MyanmarCabo VerdeCambodiaCameroonCanadaCaribbeanCentral AmericaChileChinaColombiaCongoCosta RicaCroatiaCubaCzechoslovakiaDenmarkDominicaDominican RepublicEastern AfricaEastern AsiaEastern EuropeEcuadorEgyptEl SalvadorEnglandEritreaEthiopiaEuropeFijiFranceGermanyGhanaGreeceGrenadaGuatemalaGuyanaHaitiHondurasHong KongHungaryIndiaIndonesiaIranIraqIrelandIsraelItalyJamaicaJapanJordanKazakhstanKenyaKoreaKuwaitLaosLatin AmericaLatviaLebanonLiberiaLithuaniaMalaysiaMexicoMicronesiaMiddle AfricaMoldovaMoroccoNepalNetherlandsNicaraguaNigeriaNorth AmericaNorth MacedoniaNorthern AfricaNorthern EuropeNorwayOceaniaPakistanPanamaPeruPhilippinesPolandPortugalRomaniaRussiaSaudi ArabiaScotlandSenegalSerbiaSierra LeoneSingaporeSomaliaSouth AfricaSouth AmericaSouth Central AsiaSouth Eastern AsiaSouthern EuropeSpainSri LankaSt. Vincent and the GrenadinesSudanSwedenSwitzerlandSyriaTaiwanThailandTrinidad and TobagoTurkeyUgandaUkraineUzbekistanVenezuelaVietnamWest IndiesWestern AfricaWestern AsiaWestern EuropeYemenZaireZimbabweAzores
College, Under 1 year
Income
Poverty
Unemployment
Labor Participation
Family Structure
Vehicle Availability
Education Level
Disability

College, Under 1 year Comparison

Immigrants from Uruguay

Immigrants from Korea

Tragic
Exceptional
63.4%
COLLEGE, UNDER 1 YEAR
5.8/ 100
METRIC RATING
217th/ 347
METRIC RANK
71.6%
COLLEGE, UNDER 1 YEAR
100.0/ 100
METRIC RATING
20th/ 347
METRIC RANK

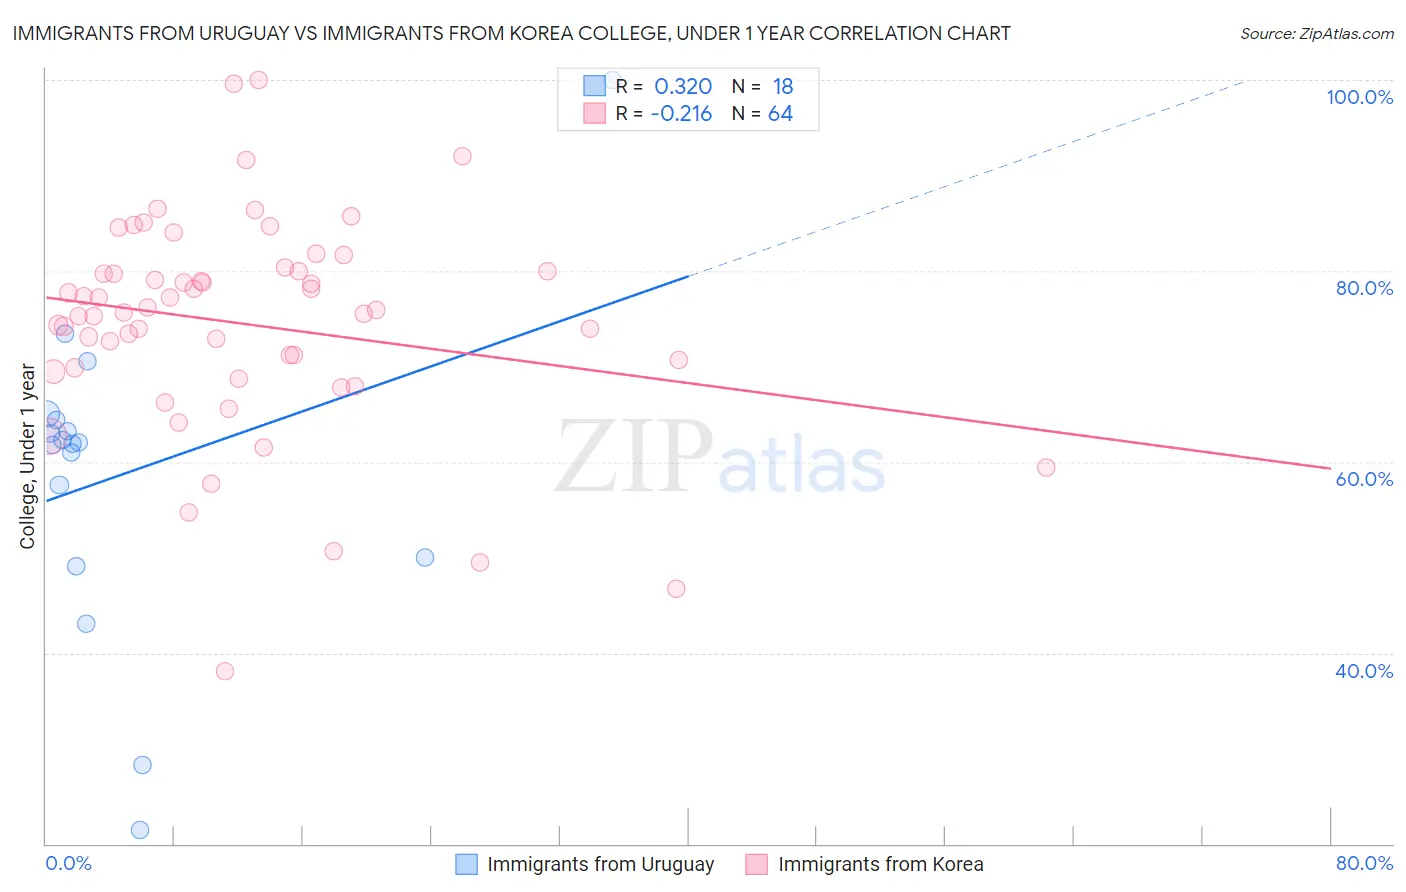
Immigrants from Uruguay vs Immigrants from Korea College, Under 1 year Correlation Chart

The statistical analysis conducted on geographies consisting of 133,259,667 people shows a mild positive correlation between the proportion of Immigrants from Uruguay and percentage of population with at least college, under 1 year education in the United States with a correlation coefficient (R) of 0.320 and weighted average of 63.4%. Similarly, the statistical analysis conducted on geographies consisting of 416,336,700 people shows a weak negative correlation between the proportion of Immigrants from Korea and percentage of population with at least college, under 1 year education in the United States with a correlation coefficient (R) of -0.216 and weighted average of 71.6%, a difference of 12.9%.
Immigrants from Uruguay vs Immigrants from Korea College, Under 1 year

College, Under 1 year Correlation Summary

MeasurementImmigrants from UruguayImmigrants from Korea
Minimum21.5%38.0%
Maximum100.0%100.0%
Range78.5%62.0%
Mean58.8%74.4%
Median62.0%75.8%
Interquartile 25% (IQ1)50.0%69.7%
Interquartile 75% (IQ3)64.4%80.0%
Interquartile Range (IQR)14.4%10.3%
Standard Deviation (Sample)17.1%11.4%
Standard Deviation (Population)16.6%11.3%

Similar Demographics by College, Under 1 year

Demographics Similar to Immigrants from Uruguay by College, Under 1 year

In terms of college, under 1 year, the demographic groups most similar to Immigrants from Uruguay are Immigrants from Panama (63.4%, a difference of 0.020%), Immigrants from Fiji (63.4%, a difference of 0.030%), Portuguese (63.4%, a difference of 0.050%), Cree (63.3%, a difference of 0.14%), and Hmong (63.5%, a difference of 0.19%).
DemographicsRating | RankCollege, Under 1 year
Ghanaians
11.2
/100
|
#210
Poor
63.9%
Native Hawaiians
10.6
/100
|
#211
Poor
63.9%
Immigrants | Middle Africa
10.5
/100
|
#212
Poor
63.9%
Immigrants | South America
9.1
/100
|
#213
Tragic
63.8%
Immigrants | Nigeria
8.8
/100
|
#214
Tragic
63.7%
Senegalese
7.7
/100
|
#215
Tragic
63.6%
Hmong
6.8
/100
|
#216
Tragic
63.5%
Immigrants | Uruguay
5.8
/100
|
#217
Tragic
63.4%
Immigrants | Panama
5.7
/100
|
#218
Tragic
63.4%
Immigrants | Fiji
5.7
/100
|
#219
Tragic
63.4%
Portuguese
5.6
/100
|
#220
Tragic
63.4%
Cree
5.2
/100
|
#221
Tragic
63.3%
Immigrants | Senegal
5.0
/100
|
#222
Tragic
63.3%
Immigrants | Costa Rica
4.5
/100
|
#223
Tragic
63.2%
Sub-Saharan Africans
4.4
/100
|
#224
Tragic
63.2%

Demographics Similar to Immigrants from Korea by College, Under 1 year

In terms of college, under 1 year, the demographic groups most similar to Immigrants from Korea are Latvian (71.6%, a difference of 0.040%), Immigrants from Switzerland (71.7%, a difference of 0.15%), Immigrants from Belgium (71.5%, a difference of 0.15%), Eastern European (71.8%, a difference of 0.28%), and Immigrants from Eastern Asia (71.3%, a difference of 0.40%).
DemographicsRating | RankCollege, Under 1 year
Cypriots
100.0
/100
|
#13
Exceptional
72.0%
Cambodians
100.0
/100
|
#14
Exceptional
71.9%
Burmese
100.0
/100
|
#15
Exceptional
71.9%
Immigrants | Japan
100.0
/100
|
#16
Exceptional
71.9%
Eastern Europeans
100.0
/100
|
#17
Exceptional
71.8%
Immigrants | Switzerland
100.0
/100
|
#18
Exceptional
71.7%
Latvians
100.0
/100
|
#19
Exceptional
71.6%
Immigrants | Korea
100.0
/100
|
#20
Exceptional
71.6%
Immigrants | Belgium
100.0
/100
|
#21
Exceptional
71.5%
Immigrants | Eastern Asia
100.0
/100
|
#22
Exceptional
71.3%
Immigrants | Northern Europe
100.0
/100
|
#23
Exceptional
71.1%
Soviet Union
100.0
/100
|
#24
Exceptional
71.1%
Bulgarians
100.0
/100
|
#25
Exceptional
71.1%
Immigrants | Denmark
100.0
/100
|
#26
Exceptional
71.0%
Immigrants | Ireland
100.0
/100
|
#27
Exceptional
71.0%