Immigrants from Singapore vs Danish College, 1 year or more

COMPARE

Immigrants from Singapore
Race
Ancestry
AfghanAfricanAlaska NativeAlaskan AthabascanAlbanianAleutAlsatianAmericanApacheArabArapahoArgentineanArmenianAssyrian/Chaldean/SyriacAustralianAustrianBahamianBangladeshiBarbadianBasqueBelgianBelizeanBermudanBhutaneseBlackfeetBolivianBrazilianBritishBritish West IndianBulgarianBurmeseCajunCambodianCanadianCape VerdeanCarpatho RusynCelticCentral AmericanCentral American IndianCherokeeCheyenneChickasawChileanChineseChippewaChoctawColombianColvilleComancheCosta RicanCreeCreekCroatianCrowCubanCypriotCzechCzechoslovakianDelawareDominicanDutchDutch West IndianEastern EuropeanEcuadorianEgyptianEnglishEstonianEthiopianEuropeanFijianFilipinoFinnishFrenchFrench American IndianFrench CanadianGermanGerman RussianGhanaianGreekGuamanian/ChamorroGuatemalanGuyaneseHaitianHmongHonduranHopiHoumaHungarianIcelanderIndian (Asian)IndonesianInupiatIranianIraqiIrishIroquoisIsraeliItalianJamaicanJapaneseJordanianKenyanKiowaKoreanLaotianLatvianLebaneseLiberianLithuanianLumbeeLuxembourgerMacedonianMalaysianMalteseMarshalleseMenomineeMexicanMexican American IndianMongolianMoroccanNative HawaiianNavajoNepaleseNew ZealanderNicaraguanNigerianNorthern EuropeanNorwegianOkinawanOsageOttawaPaiutePakistaniPalestinianPanamanianParaguayanPennsylvania GermanPeruvianPimaPolishPortuguesePotawatomiPuebloPuerto RicanPuget Sound SalishRomanianRussianSalvadoranSamoanScandinavianScotch-IrishScottishSeminoleSenegaleseSerbianShoshoneSierra LeoneanSiouxSlavicSlovakSloveneSomaliSouth AfricanSouth AmericanSouth American IndianSoviet UnionSpaniardSpanishSpanish AmericanSpanish American IndianSri LankanSubsaharan AfricanSudaneseSwedishSwissSyrianTaiwaneseThaiTlingit-HaidaTohono O'OdhamTonganTrinidadian and TobagonianTsimshianTurkishU.S. Virgin IslanderUgandanUkrainianUruguayanUteVenezuelanVietnameseWelshWest IndianYakamaYaquiYugoslavianYumanYup'ikZimbabwean
Immigration
NonimmigrantsImmigrantsAfghanistanAfricaAlbaniaArgentinaArmeniaAsiaAustraliaAustriaBahamasBangladeshBarbadosBelarusBelgiumBelizeBoliviaBosnia and HerzegovinaBrazilBulgariaBurma/MyanmarCabo VerdeCambodiaCameroonCanadaCaribbeanCentral AmericaChileChinaColombiaCongoCosta RicaCroatiaCubaCzechoslovakiaDenmarkDominicaDominican RepublicEastern AfricaEastern AsiaEastern EuropeEcuadorEgyptEl SalvadorEnglandEritreaEthiopiaEuropeFijiFranceGermanyGhanaGreeceGrenadaGuatemalaGuyanaHaitiHondurasHong KongHungaryIndiaIndonesiaIranIraqIrelandIsraelItalyJamaicaJapanJordanKazakhstanKenyaKoreaKuwaitLaosLatin AmericaLatviaLebanonLiberiaLithuaniaMalaysiaMexicoMicronesiaMiddle AfricaMoldovaMoroccoNepalNetherlandsNicaraguaNigeriaNorth AmericaNorth MacedoniaNorthern AfricaNorthern EuropeNorwayOceaniaPakistanPanamaPeruPhilippinesPolandPortugalRomaniaRussiaSaudi ArabiaScotlandSenegalSerbiaSierra LeoneSingaporeSomaliaSouth AfricaSouth AmericaSouth Central AsiaSouth Eastern AsiaSouthern EuropeSpainSri LankaSt. Vincent and the GrenadinesSudanSwedenSwitzerlandSyriaTaiwanThailandTrinidad and TobagoTurkeyUgandaUkraineUruguayUzbekistanVenezuelaVietnamWest IndiesWestern AfricaWestern AsiaWestern EuropeYemenZaireZimbabweAzores
Danish
Race
Ancestry
AfghanAfricanAlaska NativeAlaskan AthabascanAlbanianAleutAlsatianAmericanApacheArabArapahoArgentineanArmenianAssyrian/Chaldean/SyriacAustralianAustrianBahamianBangladeshiBarbadianBasqueBelgianBelizeanBermudanBhutaneseBlackfeetBolivianBrazilianBritishBritish West IndianBulgarianBurmeseCajunCambodianCanadianCape VerdeanCarpatho RusynCelticCentral AmericanCentral American IndianCherokeeCheyenneChickasawChileanChineseChippewaChoctawColombianColvilleComancheCosta RicanCreeCreekCroatianCrowCubanCypriotCzechCzechoslovakianDanishDelawareDominicanDutchDutch West IndianEastern EuropeanEcuadorianEgyptianEnglishEstonianEthiopianEuropeanFijianFilipinoFinnishFrenchFrench American IndianFrench CanadianGermanGerman RussianGhanaianGreekGuamanian/ChamorroGuatemalanGuyaneseHaitianHmongHonduranHopiHoumaHungarianIcelanderIndian (Asian)IndonesianInupiatIranianIraqiIrishIroquoisIsraeliItalianJamaicanJapaneseJordanianKenyanKiowaKoreanLaotianLatvianLebaneseLiberianLithuanianLumbeeLuxembourgerMacedonianMalaysianMalteseMarshalleseMenomineeMexicanMexican American IndianMongolianMoroccanNative HawaiianNavajoNepaleseNew ZealanderNicaraguanNigerianNorthern EuropeanNorwegianOkinawanOsageOttawaPaiutePakistaniPalestinianPanamanianParaguayanPennsylvania GermanPeruvianPimaPolishPortuguesePotawatomiPuebloPuerto RicanPuget Sound SalishRomanianRussianSalvadoranSamoanScandinavianScotch-IrishScottishSeminoleSenegaleseSerbianShoshoneSierra LeoneanSiouxSlavicSlovakSloveneSomaliSouth AfricanSouth AmericanSouth American IndianSoviet UnionSpaniardSpanishSpanish AmericanSpanish American IndianSri LankanSubsaharan AfricanSudaneseSwedishSwissSyrianTaiwaneseThaiTlingit-HaidaTohono O'OdhamTonganTrinidadian and TobagonianTsimshianTurkishU.S. Virgin IslanderUgandanUkrainianUruguayanUteVenezuelanVietnameseWelshWest IndianYakamaYaquiYugoslavianYumanYup'ikZimbabwean
Immigration
NonimmigrantsImmigrantsAfghanistanAfricaAlbaniaArgentinaArmeniaAsiaAustraliaAustriaBahamasBangladeshBarbadosBelarusBelgiumBelizeBoliviaBosnia and HerzegovinaBrazilBulgariaBurma/MyanmarCabo VerdeCambodiaCameroonCanadaCaribbeanCentral AmericaChileChinaColombiaCongoCosta RicaCroatiaCubaCzechoslovakiaDenmarkDominicaDominican RepublicEastern AfricaEastern AsiaEastern EuropeEcuadorEgyptEl SalvadorEnglandEritreaEthiopiaEuropeFijiFranceGermanyGhanaGreeceGrenadaGuatemalaGuyanaHaitiHondurasHong KongHungaryIndiaIndonesiaIranIraqIrelandIsraelItalyJamaicaJapanJordanKazakhstanKenyaKoreaKuwaitLaosLatin AmericaLatviaLebanonLiberiaLithuaniaMalaysiaMexicoMicronesiaMiddle AfricaMoldovaMoroccoNepalNetherlandsNicaraguaNigeriaNorth AmericaNorth MacedoniaNorthern AfricaNorthern EuropeNorwayOceaniaPakistanPanamaPeruPhilippinesPolandPortugalRomaniaRussiaSaudi ArabiaScotlandSenegalSerbiaSierra LeoneSomaliaSouth AfricaSouth AmericaSouth Central AsiaSouth Eastern AsiaSouthern EuropeSpainSri LankaSt. Vincent and the GrenadinesSudanSwedenSwitzerlandSyriaTaiwanThailandTrinidad and TobagoTurkeyUgandaUkraineUruguayUzbekistanVenezuelaVietnamWest IndiesWestern AfricaWestern AsiaWestern EuropeYemenZaireZimbabweAzores
College, 1 year or more
Income
Poverty
Unemployment
Labor Participation
Family Structure
Vehicle Availability
Education Level
Disability

College, 1 year or more Comparison

Immigrants from Singapore

Danes

Exceptional
Exceptional
70.1%
COLLEGE, 1 YEAR OR MORE
100.0/ 100
METRIC RATING
2nd/ 347
METRIC RANK
61.7%
COLLEGE, 1 YEAR OR MORE
94.8/ 100
METRIC RATING
114th/ 347
METRIC RANK

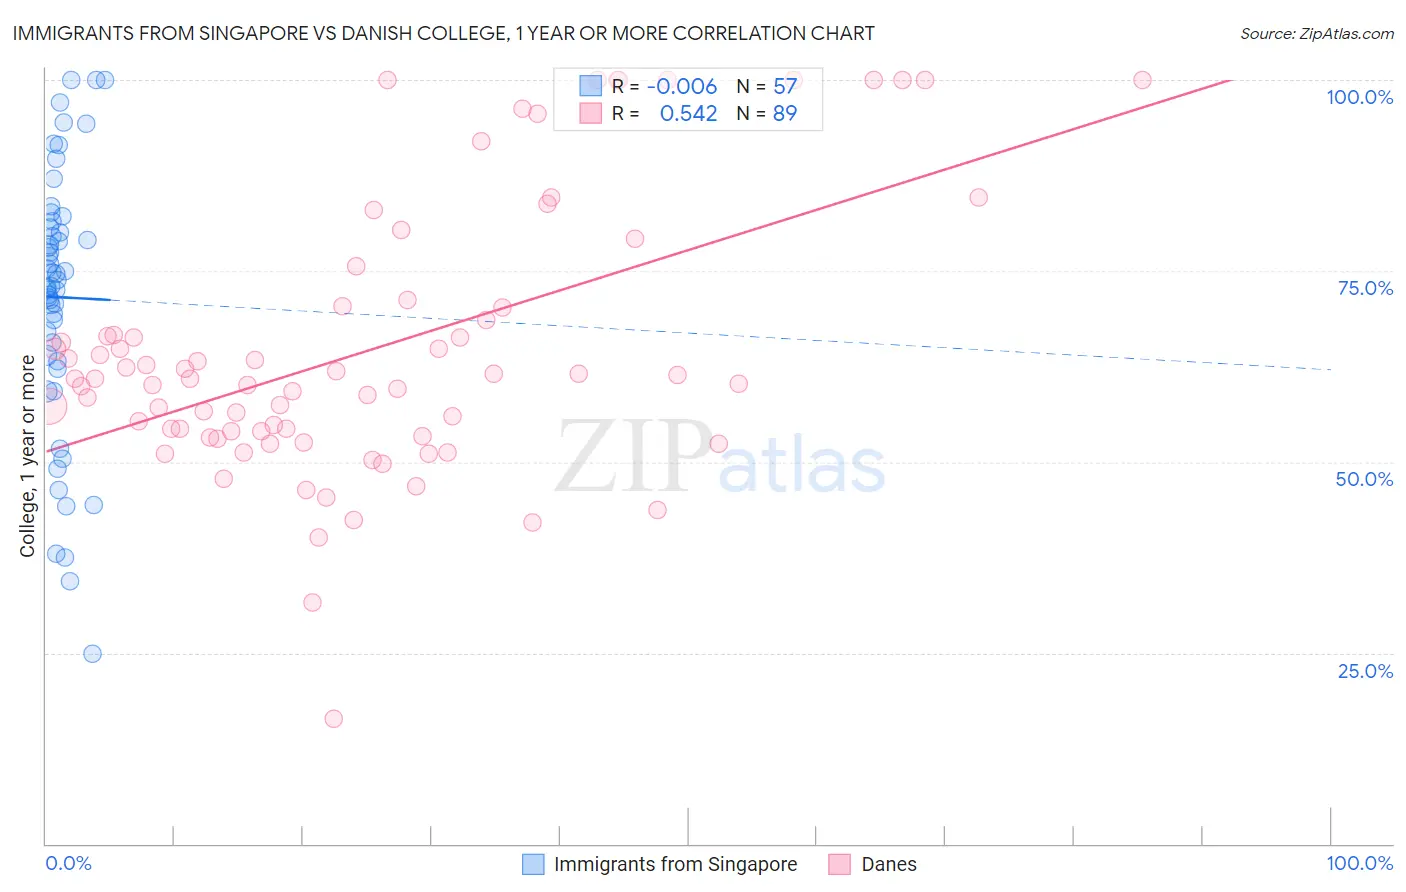
Immigrants from Singapore vs Danish College, 1 year or more Correlation Chart

The statistical analysis conducted on geographies consisting of 137,521,700 people shows no correlation between the proportion of Immigrants from Singapore and percentage of population with at least college, 1 year or more education in the United States with a correlation coefficient (R) of -0.006 and weighted average of 70.1%. Similarly, the statistical analysis conducted on geographies consisting of 474,193,590 people shows a substantial positive correlation between the proportion of Danes and percentage of population with at least college, 1 year or more education in the United States with a correlation coefficient (R) of 0.542 and weighted average of 61.7%, a difference of 13.7%.
Immigrants from Singapore vs Danish College, 1 year or more

College, 1 year or more Correlation Summary

MeasurementImmigrants from SingaporeDanish
Minimum24.9%16.4%
Maximum100.0%100.0%
Range75.1%83.6%
Mean71.6%64.6%
Median73.8%60.9%
Interquartile 25% (IQ1)63.6%53.6%
Interquartile 75% (IQ3)81.1%70.3%
Interquartile Range (IQR)17.5%16.7%
Standard Deviation (Sample)17.1%17.7%
Standard Deviation (Population)17.0%17.6%

Similar Demographics by College, 1 year or more

Demographics Similar to Immigrants from Singapore by College, 1 year or more

In terms of college, 1 year or more, the demographic groups most similar to Immigrants from Singapore are Iranian (70.0%, a difference of 0.22%), Immigrants from Taiwan (69.6%, a difference of 0.72%), Immigrants from India (69.6%, a difference of 0.72%), Immigrants from Iran (69.5%, a difference of 0.92%), and Filipino (71.0%, a difference of 1.2%).
DemographicsRating | RankCollege, 1 year or more
Filipinos
100.0
/100
|
#1
Exceptional
71.0%
Immigrants | Singapore
100.0
/100
|
#2
Exceptional
70.1%
Iranians
100.0
/100
|
#3
Exceptional
70.0%
Immigrants | Taiwan
100.0
/100
|
#4
Exceptional
69.6%
Immigrants | India
100.0
/100
|
#5
Exceptional
69.6%
Immigrants | Iran
100.0
/100
|
#6
Exceptional
69.5%
Okinawans
100.0
/100
|
#7
Exceptional
69.0%
Thais
100.0
/100
|
#8
Exceptional
68.6%
Immigrants | Israel
100.0
/100
|
#9
Exceptional
67.8%
Immigrants | Australia
100.0
/100
|
#10
Exceptional
67.7%
Immigrants | South Central Asia
100.0
/100
|
#11
Exceptional
67.1%
Cypriots
100.0
/100
|
#12
Exceptional
67.0%
Immigrants | Sweden
100.0
/100
|
#13
Exceptional
66.8%
Burmese
100.0
/100
|
#14
Exceptional
66.7%
Cambodians
100.0
/100
|
#15
Exceptional
66.7%

Demographics Similar to Danes by College, 1 year or more

In terms of college, 1 year or more, the demographic groups most similar to Danes are Norwegian (61.7%, a difference of 0.070%), Ukrainian (61.8%, a difference of 0.11%), Lebanese (61.6%, a difference of 0.17%), Austrian (61.8%, a difference of 0.18%), and Arab (61.6%, a difference of 0.21%).
DemographicsRating | RankCollege, 1 year or more
Immigrants | Ukraine
95.8
/100
|
#107
Exceptional
61.9%
Syrians
95.7
/100
|
#108
Exceptional
61.9%
Immigrants | Northern Africa
95.7
/100
|
#109
Exceptional
61.9%
Europeans
95.6
/100
|
#110
Exceptional
61.8%
Macedonians
95.6
/100
|
#111
Exceptional
61.8%
Austrians
95.4
/100
|
#112
Exceptional
61.8%
Ukrainians
95.2
/100
|
#113
Exceptional
61.8%
Danes
94.8
/100
|
#114
Exceptional
61.7%
Norwegians
94.5
/100
|
#115
Exceptional
61.7%
Lebanese
94.1
/100
|
#116
Exceptional
61.6%
Arabs
93.9
/100
|
#117
Exceptional
61.6%
Immigrants | Brazil
93.9
/100
|
#118
Exceptional
61.6%
Assyrians/Chaldeans/Syriacs
93.3
/100
|
#119
Exceptional
61.5%
Pakistanis
93.2
/100
|
#120
Exceptional
61.5%
Immigrants | Jordan
92.7
/100
|
#121
Exceptional
61.4%