Immigrants from Kazakhstan vs Immigrants from Peru GED/Equivalency

COMPARE

Immigrants from Kazakhstan
Race
Ancestry
AfghanAfricanAlaska NativeAlaskan AthabascanAlbanianAleutAlsatianAmericanApacheArabArapahoArgentineanArmenianAssyrian/Chaldean/SyriacAustralianAustrianBahamianBangladeshiBarbadianBasqueBelgianBelizeanBermudanBhutaneseBlackfeetBolivianBrazilianBritishBritish West IndianBulgarianBurmeseCajunCambodianCanadianCape VerdeanCarpatho RusynCelticCentral AmericanCentral American IndianCherokeeCheyenneChickasawChileanChineseChippewaChoctawColombianColvilleComancheCosta RicanCreeCreekCroatianCrowCubanCypriotCzechCzechoslovakianDanishDelawareDominicanDutchDutch West IndianEastern EuropeanEcuadorianEgyptianEnglishEstonianEthiopianEuropeanFijianFilipinoFinnishFrenchFrench American IndianFrench CanadianGermanGerman RussianGhanaianGreekGuamanian/ChamorroGuatemalanGuyaneseHaitianHmongHonduranHopiHoumaHungarianIcelanderIndian (Asian)IndonesianInupiatIranianIraqiIrishIroquoisIsraeliItalianJamaicanJapaneseJordanianKenyanKiowaKoreanLaotianLatvianLebaneseLiberianLithuanianLumbeeLuxembourgerMacedonianMalaysianMalteseMarshalleseMenomineeMexicanMexican American IndianMongolianMoroccanNative HawaiianNavajoNepaleseNew ZealanderNicaraguanNigerianNorthern EuropeanNorwegianOkinawanOsageOttawaPaiutePakistaniPalestinianPanamanianParaguayanPennsylvania GermanPeruvianPimaPolishPortuguesePotawatomiPuebloPuerto RicanPuget Sound SalishRomanianRussianSalvadoranSamoanScandinavianScotch-IrishScottishSeminoleSenegaleseSerbianShoshoneSierra LeoneanSiouxSlavicSlovakSloveneSomaliSouth AfricanSouth AmericanSouth American IndianSoviet UnionSpaniardSpanishSpanish AmericanSpanish American IndianSri LankanSubsaharan AfricanSudaneseSwedishSwissSyrianTaiwaneseThaiTlingit-HaidaTohono O'OdhamTonganTrinidadian and TobagonianTsimshianTurkishU.S. Virgin IslanderUgandanUkrainianUruguayanUteVenezuelanVietnameseWelshWest IndianYakamaYaquiYugoslavianYumanYup'ikZimbabwean
Immigration
NonimmigrantsImmigrantsAfghanistanAfricaAlbaniaArgentinaArmeniaAsiaAustraliaAustriaBahamasBangladeshBarbadosBelarusBelgiumBelizeBoliviaBosnia and HerzegovinaBrazilBulgariaBurma/MyanmarCabo VerdeCambodiaCameroonCanadaCaribbeanCentral AmericaChileChinaColombiaCongoCosta RicaCroatiaCubaCzechoslovakiaDenmarkDominicaDominican RepublicEastern AfricaEastern AsiaEastern EuropeEcuadorEgyptEl SalvadorEnglandEritreaEthiopiaEuropeFijiFranceGermanyGhanaGreeceGrenadaGuatemalaGuyanaHaitiHondurasHong KongHungaryIndiaIndonesiaIranIraqIrelandIsraelItalyJamaicaJapanJordanKazakhstanKenyaKoreaKuwaitLaosLatin AmericaLatviaLebanonLiberiaLithuaniaMalaysiaMexicoMicronesiaMiddle AfricaMoldovaMoroccoNepalNetherlandsNicaraguaNigeriaNorth AmericaNorth MacedoniaNorthern AfricaNorthern EuropeNorwayOceaniaPakistanPanamaPhilippinesPolandPortugalRomaniaRussiaSaudi ArabiaScotlandSenegalSerbiaSierra LeoneSingaporeSomaliaSouth AfricaSouth AmericaSouth Central AsiaSouth Eastern AsiaSouthern EuropeSpainSri LankaSt. Vincent and the GrenadinesSudanSwedenSwitzerlandSyriaTaiwanThailandTrinidad and TobagoTurkeyUgandaUkraineUruguayUzbekistanVenezuelaVietnamWest IndiesWestern AfricaWestern AsiaWestern EuropeYemenZaireZimbabweAzores
Immigrants from Peru
Race
Ancestry
AfghanAfricanAlaska NativeAlaskan AthabascanAlbanianAleutAlsatianAmericanApacheArabArapahoArgentineanArmenianAssyrian/Chaldean/SyriacAustralianAustrianBahamianBangladeshiBarbadianBasqueBelgianBelizeanBermudanBhutaneseBlackfeetBolivianBrazilianBritishBritish West IndianBulgarianBurmeseCajunCambodianCanadianCape VerdeanCarpatho RusynCelticCentral AmericanCentral American IndianCherokeeCheyenneChickasawChileanChineseChippewaChoctawColombianColvilleComancheCosta RicanCreeCreekCroatianCrowCubanCypriotCzechCzechoslovakianDanishDelawareDominicanDutchDutch West IndianEastern EuropeanEcuadorianEgyptianEnglishEstonianEthiopianEuropeanFijianFilipinoFinnishFrenchFrench American IndianFrench CanadianGermanGerman RussianGhanaianGreekGuamanian/ChamorroGuatemalanGuyaneseHaitianHmongHonduranHopiHoumaHungarianIcelanderIndian (Asian)IndonesianInupiatIranianIraqiIrishIroquoisIsraeliItalianJamaicanJapaneseJordanianKenyanKiowaKoreanLaotianLatvianLebaneseLiberianLithuanianLumbeeLuxembourgerMacedonianMalaysianMalteseMarshalleseMenomineeMexicanMexican American IndianMongolianMoroccanNative HawaiianNavajoNepaleseNew ZealanderNicaraguanNigerianNorthern EuropeanNorwegianOkinawanOsageOttawaPaiutePakistaniPalestinianPanamanianParaguayanPennsylvania GermanPeruvianPimaPolishPortuguesePotawatomiPuebloPuerto RicanPuget Sound SalishRomanianRussianSalvadoranSamoanScandinavianScotch-IrishScottishSeminoleSenegaleseSerbianShoshoneSierra LeoneanSiouxSlavicSlovakSloveneSomaliSouth AfricanSouth AmericanSouth American IndianSoviet UnionSpaniardSpanishSpanish AmericanSpanish American IndianSri LankanSubsaharan AfricanSudaneseSwedishSwissSyrianTaiwaneseThaiTlingit-HaidaTohono O'OdhamTonganTrinidadian and TobagonianTsimshianTurkishU.S. Virgin IslanderUgandanUkrainianUruguayanUteVenezuelanVietnameseWelshWest IndianYakamaYaquiYugoslavianYumanYup'ikZimbabwean
Immigration
NonimmigrantsImmigrantsAfghanistanAfricaAlbaniaArgentinaArmeniaAsiaAustraliaAustriaBahamasBangladeshBarbadosBelarusBelgiumBelizeBoliviaBosnia and HerzegovinaBrazilBulgariaBurma/MyanmarCabo VerdeCambodiaCameroonCanadaCaribbeanCentral AmericaChileChinaColombiaCongoCosta RicaCroatiaCubaCzechoslovakiaDenmarkDominicaDominican RepublicEastern AfricaEastern AsiaEastern EuropeEcuadorEgyptEl SalvadorEnglandEritreaEthiopiaEuropeFijiFranceGermanyGhanaGreeceGrenadaGuatemalaGuyanaHaitiHondurasHong KongHungaryIndiaIndonesiaIranIraqIrelandIsraelItalyJamaicaJapanJordanKenyaKoreaKuwaitLaosLatin AmericaLatviaLebanonLiberiaLithuaniaMalaysiaMexicoMicronesiaMiddle AfricaMoldovaMoroccoNepalNetherlandsNicaraguaNigeriaNorth AmericaNorth MacedoniaNorthern AfricaNorthern EuropeNorwayOceaniaPakistanPanamaPeruPhilippinesPolandPortugalRomaniaRussiaSaudi ArabiaScotlandSenegalSerbiaSierra LeoneSingaporeSomaliaSouth AfricaSouth AmericaSouth Central AsiaSouth Eastern AsiaSouthern EuropeSpainSri LankaSt. Vincent and the GrenadinesSudanSwedenSwitzerlandSyriaTaiwanThailandTrinidad and TobagoTurkeyUgandaUkraineUruguayUzbekistanVenezuelaVietnamWest IndiesWestern AfricaWestern AsiaWestern EuropeYemenZaireZimbabweAzores
GED/Equivalency
Income
Poverty
Unemployment
Labor Participation
Family Structure
Vehicle Availability
Education Level
Disability

GED/Equivalency Comparison

Immigrants from Kazakhstan

Immigrants from Peru

Exceptional
Tragic
87.0%
GED/EQUIVALENCY
94.7/ 100
METRIC RATING
114th/ 347
METRIC RANK
84.2%
GED/EQUIVALENCY
2.7/ 100
METRIC RATING
238th/ 347
METRIC RANK

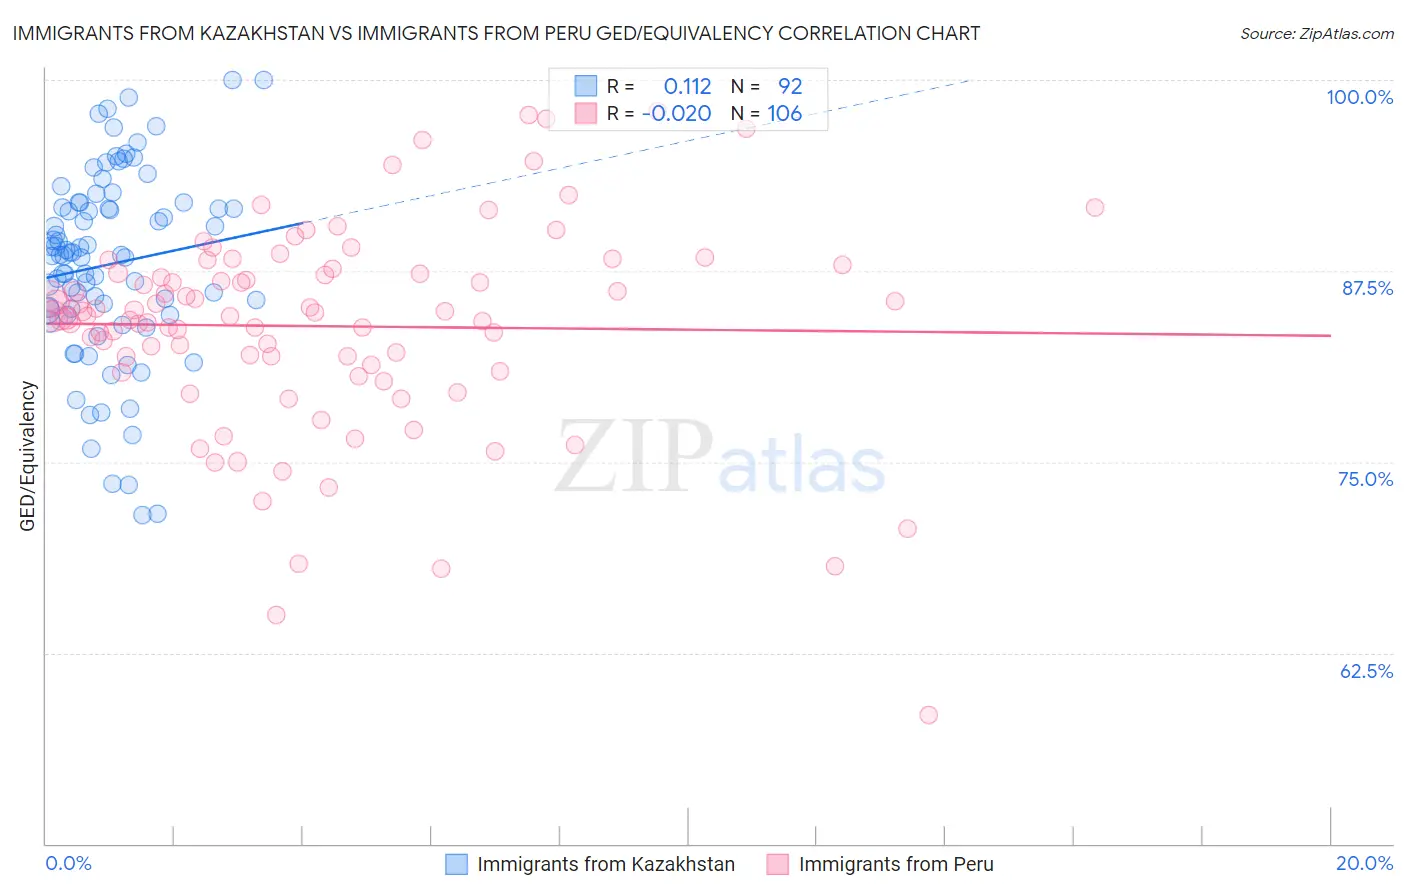
Immigrants from Kazakhstan vs Immigrants from Peru GED/Equivalency Correlation Chart

The statistical analysis conducted on geographies consisting of 124,444,172 people shows a poor positive correlation between the proportion of Immigrants from Kazakhstan and percentage of population with at least ged/equivalency education in the United States with a correlation coefficient (R) of 0.112 and weighted average of 87.0%. Similarly, the statistical analysis conducted on geographies consisting of 328,860,880 people shows no correlation between the proportion of Immigrants from Peru and percentage of population with at least ged/equivalency education in the United States with a correlation coefficient (R) of -0.020 and weighted average of 84.2%, a difference of 3.4%.
Immigrants from Kazakhstan vs Immigrants from Peru GED/Equivalency

GED/Equivalency Correlation Summary

MeasurementImmigrants from KazakhstanImmigrants from Peru
Minimum71.5%58.5%
Maximum100.0%97.9%
Range28.5%39.5%
Mean87.9%83.9%
Median88.5%84.6%
Interquartile 25% (IQ1)84.8%81.3%
Interquartile 75% (IQ3)91.8%87.4%
Interquartile Range (IQR)7.0%6.1%
Standard Deviation (Sample)6.2%6.8%
Standard Deviation (Population)6.2%6.8%

Similar Demographics by GED/Equivalency

Demographics Similar to Immigrants from Kazakhstan by GED/Equivalency

In terms of ged/equivalency, the demographic groups most similar to Immigrants from Kazakhstan are Tlingit-Haida (87.0%, a difference of 0.010%), Assyrian/Chaldean/Syriac (87.0%, a difference of 0.010%), Mongolian (87.0%, a difference of 0.010%), Swiss (87.0%, a difference of 0.020%), and Egyptian (87.1%, a difference of 0.060%).
DemographicsRating | RankGED/Equivalency
Icelanders
95.7
/100
|
#107
Exceptional
87.1%
Canadians
95.6
/100
|
#108
Exceptional
87.1%
Immigrants | Eastern Europe
95.5
/100
|
#109
Exceptional
87.1%
Egyptians
95.3
/100
|
#110
Exceptional
87.1%
French
95.2
/100
|
#111
Exceptional
87.1%
Tlingit-Haida
94.8
/100
|
#112
Exceptional
87.0%
Assyrians/Chaldeans/Syriacs
94.8
/100
|
#113
Exceptional
87.0%
Immigrants | Kazakhstan
94.7
/100
|
#114
Exceptional
87.0%
Mongolians
94.6
/100
|
#115
Exceptional
87.0%
Swiss
94.5
/100
|
#116
Exceptional
87.0%
Immigrants | Hong Kong
93.8
/100
|
#117
Exceptional
86.9%
French Canadians
93.2
/100
|
#118
Exceptional
86.9%
Immigrants | China
93.2
/100
|
#119
Exceptional
86.9%
Scotch-Irish
91.6
/100
|
#120
Exceptional
86.8%
Immigrants | Lebanon
90.9
/100
|
#121
Exceptional
86.8%

Demographics Similar to Immigrants from Peru by GED/Equivalency

In terms of ged/equivalency, the demographic groups most similar to Immigrants from Peru are Immigrants from Bahamas (84.2%, a difference of 0.030%), Immigrants from South Eastern Asia (84.1%, a difference of 0.040%), Subsaharan African (84.2%, a difference of 0.060%), Ghanaian (84.3%, a difference of 0.13%), and Immigrants from Eritrea (84.3%, a difference of 0.13%).
DemographicsRating | RankGED/Equivalency
Immigrants | Middle Africa
4.3
/100
|
#231
Tragic
84.4%
Immigrants | South America
4.2
/100
|
#232
Tragic
84.4%
Immigrants | Panama
4.1
/100
|
#233
Tragic
84.4%
Immigrants | Nigeria
3.6
/100
|
#234
Tragic
84.3%
Ghanaians
3.5
/100
|
#235
Tragic
84.3%
Immigrants | Eritrea
3.5
/100
|
#236
Tragic
84.3%
Sub-Saharan Africans
3.0
/100
|
#237
Tragic
84.2%
Immigrants | Peru
2.7
/100
|
#238
Tragic
84.2%
Immigrants | Bahamas
2.6
/100
|
#239
Tragic
84.2%
Immigrants | South Eastern Asia
2.5
/100
|
#240
Tragic
84.1%
Senegalese
1.9
/100
|
#241
Tragic
84.0%
Sri Lankans
1.9
/100
|
#242
Tragic
84.0%
Cherokee
1.3
/100
|
#243
Tragic
83.9%
Immigrants | Ghana
1.3
/100
|
#244
Tragic
83.9%
Immigrants | Senegal
1.2
/100
|
#245
Tragic
83.8%