Immigrants from Iraq vs Vietnamese College, 1 year or more

COMPARE

Immigrants from Iraq
Race
Ancestry
AfghanAfricanAlaska NativeAlaskan AthabascanAlbanianAleutAlsatianAmericanApacheArabArapahoArgentineanArmenianAssyrian/Chaldean/SyriacAustralianAustrianBahamianBangladeshiBarbadianBasqueBelgianBelizeanBermudanBhutaneseBlackfeetBolivianBrazilianBritishBritish West IndianBulgarianBurmeseCajunCambodianCanadianCape VerdeanCarpatho RusynCelticCentral AmericanCentral American IndianCherokeeCheyenneChickasawChileanChineseChippewaChoctawColombianColvilleComancheCosta RicanCreeCreekCroatianCrowCubanCypriotCzechCzechoslovakianDanishDelawareDominicanDutchDutch West IndianEastern EuropeanEcuadorianEgyptianEnglishEstonianEthiopianEuropeanFijianFilipinoFinnishFrenchFrench American IndianFrench CanadianGermanGerman RussianGhanaianGreekGuamanian/ChamorroGuatemalanGuyaneseHaitianHmongHonduranHopiHoumaHungarianIcelanderIndian (Asian)IndonesianInupiatIranianIraqiIrishIroquoisIsraeliItalianJamaicanJapaneseJordanianKenyanKiowaKoreanLaotianLatvianLebaneseLiberianLithuanianLumbeeLuxembourgerMacedonianMalaysianMalteseMarshalleseMenomineeMexicanMexican American IndianMongolianMoroccanNative HawaiianNavajoNepaleseNew ZealanderNicaraguanNigerianNorthern EuropeanNorwegianOkinawanOsageOttawaPaiutePakistaniPalestinianPanamanianParaguayanPennsylvania GermanPeruvianPimaPolishPortuguesePotawatomiPuebloPuerto RicanPuget Sound SalishRomanianRussianSalvadoranSamoanScandinavianScotch-IrishScottishSeminoleSenegaleseSerbianShoshoneSierra LeoneanSiouxSlavicSlovakSloveneSomaliSouth AfricanSouth AmericanSouth American IndianSoviet UnionSpaniardSpanishSpanish AmericanSpanish American IndianSri LankanSubsaharan AfricanSudaneseSwedishSwissSyrianTaiwaneseThaiTlingit-HaidaTohono O'OdhamTonganTrinidadian and TobagonianTsimshianTurkishU.S. Virgin IslanderUgandanUkrainianUruguayanUteVenezuelanWelshWest IndianYakamaYaquiYugoslavianYumanYup'ikZimbabwean
Immigration
NonimmigrantsImmigrantsAfghanistanAfricaAlbaniaArgentinaArmeniaAsiaAustraliaAustriaBahamasBangladeshBarbadosBelarusBelgiumBelizeBoliviaBosnia and HerzegovinaBrazilBulgariaBurma/MyanmarCabo VerdeCambodiaCameroonCanadaCaribbeanCentral AmericaChileChinaColombiaCongoCosta RicaCroatiaCubaCzechoslovakiaDenmarkDominicaDominican RepublicEastern AfricaEastern AsiaEastern EuropeEcuadorEgyptEl SalvadorEnglandEritreaEthiopiaEuropeFijiFranceGermanyGhanaGreeceGrenadaGuatemalaGuyanaHaitiHondurasHong KongHungaryIndiaIndonesiaIranIraqIrelandIsraelItalyJamaicaJapanJordanKazakhstanKenyaKoreaKuwaitLaosLatin AmericaLatviaLebanonLiberiaLithuaniaMalaysiaMexicoMicronesiaMiddle AfricaMoldovaMoroccoNepalNetherlandsNicaraguaNigeriaNorth AmericaNorth MacedoniaNorthern AfricaNorthern EuropeNorwayOceaniaPakistanPanamaPeruPhilippinesPolandPortugalRomaniaRussiaSaudi ArabiaScotlandSenegalSerbiaSierra LeoneSingaporeSomaliaSouth AfricaSouth AmericaSouth Central AsiaSouth Eastern AsiaSouthern EuropeSpainSri LankaSt. Vincent and the GrenadinesSudanSwedenSwitzerlandSyriaTaiwanThailandTrinidad and TobagoTurkeyUgandaUkraineUruguayUzbekistanVenezuelaVietnamWest IndiesWestern AfricaWestern AsiaWestern EuropeYemenZaireZimbabweAzores
Vietnamese
Race
Ancestry
AfghanAfricanAlaska NativeAlaskan AthabascanAlbanianAleutAlsatianAmericanApacheArabArapahoArgentineanArmenianAssyrian/Chaldean/SyriacAustralianAustrianBahamianBangladeshiBarbadianBasqueBelgianBelizeanBermudanBhutaneseBlackfeetBolivianBrazilianBritishBritish West IndianBulgarianBurmeseCajunCambodianCanadianCape VerdeanCarpatho RusynCelticCentral AmericanCentral American IndianCherokeeCheyenneChickasawChileanChineseChippewaChoctawColombianColvilleComancheCosta RicanCreeCreekCroatianCrowCubanCypriotCzechCzechoslovakianDanishDelawareDominicanDutchDutch West IndianEastern EuropeanEcuadorianEgyptianEnglishEstonianEthiopianEuropeanFijianFilipinoFinnishFrenchFrench American IndianFrench CanadianGermanGerman RussianGhanaianGreekGuamanian/ChamorroGuatemalanGuyaneseHaitianHmongHonduranHopiHoumaHungarianIcelanderIndian (Asian)IndonesianInupiatIranianIraqiIrishIroquoisIsraeliItalianJamaicanJapaneseJordanianKenyanKiowaKoreanLaotianLatvianLebaneseLiberianLithuanianLumbeeLuxembourgerMacedonianMalaysianMalteseMarshalleseMenomineeMexicanMexican American IndianMongolianMoroccanNative HawaiianNavajoNepaleseNew ZealanderNicaraguanNigerianNorthern EuropeanNorwegianOkinawanOsageOttawaPaiutePakistaniPalestinianPanamanianParaguayanPennsylvania GermanPeruvianPimaPolishPortuguesePotawatomiPuebloPuerto RicanPuget Sound SalishRomanianRussianSalvadoranSamoanScandinavianScotch-IrishScottishSeminoleSenegaleseSerbianShoshoneSierra LeoneanSiouxSlavicSlovakSloveneSomaliSouth AfricanSouth AmericanSouth American IndianSoviet UnionSpaniardSpanishSpanish AmericanSpanish American IndianSri LankanSubsaharan AfricanSudaneseSwedishSwissSyrianTaiwaneseThaiTlingit-HaidaTohono O'OdhamTonganTrinidadian and TobagonianTsimshianTurkishU.S. Virgin IslanderUgandanUkrainianUruguayanUteVenezuelanVietnameseWelshWest IndianYakamaYaquiYugoslavianYumanYup'ikZimbabwean
Immigration
NonimmigrantsImmigrantsAfghanistanAfricaAlbaniaArgentinaArmeniaAsiaAustraliaAustriaBahamasBangladeshBarbadosBelarusBelgiumBelizeBoliviaBosnia and HerzegovinaBrazilBulgariaBurma/MyanmarCabo VerdeCambodiaCameroonCanadaCaribbeanCentral AmericaChileChinaColombiaCongoCosta RicaCroatiaCubaCzechoslovakiaDenmarkDominicaDominican RepublicEastern AfricaEastern AsiaEastern EuropeEcuadorEgyptEl SalvadorEnglandEritreaEthiopiaEuropeFijiFranceGermanyGhanaGreeceGrenadaGuatemalaGuyanaHaitiHondurasHong KongHungaryIndiaIndonesiaIranIrelandIsraelItalyJamaicaJapanJordanKazakhstanKenyaKoreaKuwaitLaosLatin AmericaLatviaLebanonLiberiaLithuaniaMalaysiaMexicoMicronesiaMiddle AfricaMoldovaMoroccoNepalNetherlandsNicaraguaNigeriaNorth AmericaNorth MacedoniaNorthern AfricaNorthern EuropeNorwayOceaniaPakistanPanamaPeruPhilippinesPolandPortugalRomaniaRussiaSaudi ArabiaScotlandSenegalSerbiaSierra LeoneSingaporeSomaliaSouth AfricaSouth AmericaSouth Central AsiaSouth Eastern AsiaSouthern EuropeSpainSri LankaSt. Vincent and the GrenadinesSudanSwedenSwitzerlandSyriaTaiwanThailandTrinidad and TobagoTurkeyUgandaUkraineUruguayUzbekistanVenezuelaVietnamWest IndiesWestern AfricaWestern AsiaWestern EuropeYemenZaireZimbabweAzores
College, 1 year or more
Income
Poverty
Unemployment
Labor Participation
Family Structure
Vehicle Availability
Education Level
Disability

College, 1 year or more Comparison

Immigrants from Iraq

Vietnamese

Good
Tragic
60.0%
COLLEGE, 1 YEAR OR MORE
67.0/ 100
METRIC RATING
159th/ 347
METRIC RANK
57.0%
COLLEGE, 1 YEAR OR MORE
4.7/ 100
METRIC RATING
225th/ 347
METRIC RANK

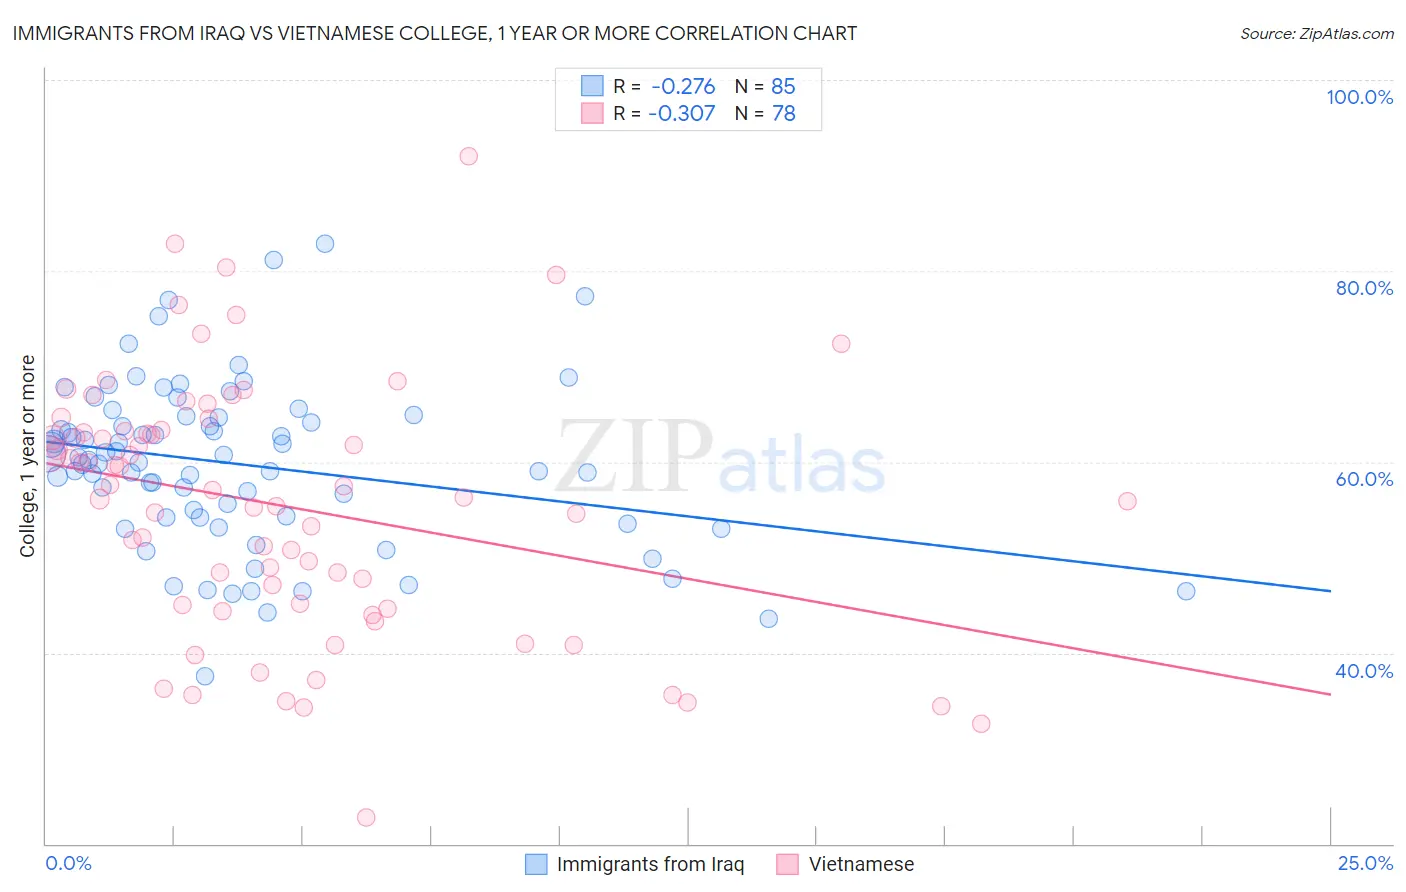
Immigrants from Iraq vs Vietnamese College, 1 year or more Correlation Chart

The statistical analysis conducted on geographies consisting of 194,780,026 people shows a weak negative correlation between the proportion of Immigrants from Iraq and percentage of population with at least college, 1 year or more education in the United States with a correlation coefficient (R) of -0.276 and weighted average of 60.0%. Similarly, the statistical analysis conducted on geographies consisting of 170,751,543 people shows a mild negative correlation between the proportion of Vietnamese and percentage of population with at least college, 1 year or more education in the United States with a correlation coefficient (R) of -0.307 and weighted average of 57.0%, a difference of 5.1%.
Immigrants from Iraq vs Vietnamese College, 1 year or more

College, 1 year or more Correlation Summary

MeasurementImmigrants from IraqVietnamese
Minimum37.6%22.8%
Maximum82.9%92.0%
Range45.3%69.3%
Mean59.7%55.4%
Median60.2%56.7%
Interquartile 25% (IQ1)54.1%45.0%
Interquartile 75% (IQ3)64.8%63.2%
Interquartile Range (IQR)10.6%18.3%
Standard Deviation (Sample)8.6%13.4%
Standard Deviation (Population)8.6%13.3%

Similar Demographics by College, 1 year or more

Demographics Similar to Immigrants from Iraq by College, 1 year or more

In terms of college, 1 year or more, the demographic groups most similar to Immigrants from Iraq are English (60.0%, a difference of 0.010%), South American Indian (60.0%, a difference of 0.010%), Immigrants from Armenia (60.0%, a difference of 0.11%), Somali (59.9%, a difference of 0.15%), and Sudanese (60.2%, a difference of 0.37%).
DemographicsRating | RankCollege, 1 year or more
Immigrants | Germany
76.1
/100
|
#152
Good
60.3%
Sierra Leoneans
74.1
/100
|
#153
Good
60.2%
Sudanese
73.0
/100
|
#154
Good
60.2%
Moroccans
72.9
/100
|
#155
Good
60.2%
Finns
72.9
/100
|
#156
Good
60.2%
Immigrants | Armenia
68.8
/100
|
#157
Good
60.0%
English
67.2
/100
|
#158
Good
60.0%
Immigrants | Iraq
67.0
/100
|
#159
Good
60.0%
South American Indians
66.9
/100
|
#160
Good
60.0%
Somalis
64.5
/100
|
#161
Good
59.9%
Koreans
58.5
/100
|
#162
Average
59.7%
Immigrants | Somalia
58.3
/100
|
#163
Average
59.7%
Belgians
58.1
/100
|
#164
Average
59.7%
Irish
56.1
/100
|
#165
Average
59.6%
Immigrants | Africa
56.1
/100
|
#166
Average
59.6%

Demographics Similar to Vietnamese by College, 1 year or more

In terms of college, 1 year or more, the demographic groups most similar to Vietnamese are Immigrants from Western Africa (57.0%, a difference of 0.030%), Immigrants (57.0%, a difference of 0.090%), Portuguese (57.2%, a difference of 0.21%), Hmong (57.2%, a difference of 0.21%), and Immigrants from Fiji (56.9%, a difference of 0.24%).
DemographicsRating | RankCollege, 1 year or more
Native Hawaiians
9.0
/100
|
#218
Tragic
57.6%
Whites/Caucasians
8.7
/100
|
#219
Tragic
57.6%
Immigrants | Costa Rica
8.0
/100
|
#220
Tragic
57.5%
Immigrants | Ghana
7.7
/100
|
#221
Tragic
57.4%
Sub-Saharan Africans
6.1
/100
|
#222
Tragic
57.3%
Portuguese
5.4
/100
|
#223
Tragic
57.2%
Hmong
5.4
/100
|
#224
Tragic
57.2%
Vietnamese
4.7
/100
|
#225
Tragic
57.0%
Immigrants | Western Africa
4.6
/100
|
#226
Tragic
57.0%
Immigrants | Immigrants
4.4
/100
|
#227
Tragic
57.0%
Immigrants | Fiji
4.0
/100
|
#228
Tragic
56.9%
Cree
3.6
/100
|
#229
Tragic
56.8%
Liberians
3.1
/100
|
#230
Tragic
56.7%
Immigrants | Burma/Myanmar
2.7
/100
|
#231
Tragic
56.6%
Immigrants | Bangladesh
2.6
/100
|
#232
Tragic
56.6%