Immigrants from Eastern Africa vs Chilean College, Under 1 year
COMPARE
Immigrants from Eastern Africa
Chilean
College, Under 1 year
College, Under 1 year Comparison
Immigrants from Eastern Africa
Chileans
67.0%
COLLEGE, UNDER 1 YEAR
89.5/ 100
METRIC RATING
129th/ 347
METRIC RANK
67.6%
COLLEGE, UNDER 1 YEAR
95.3/ 100
METRIC RATING
114th/ 347
METRIC RANK
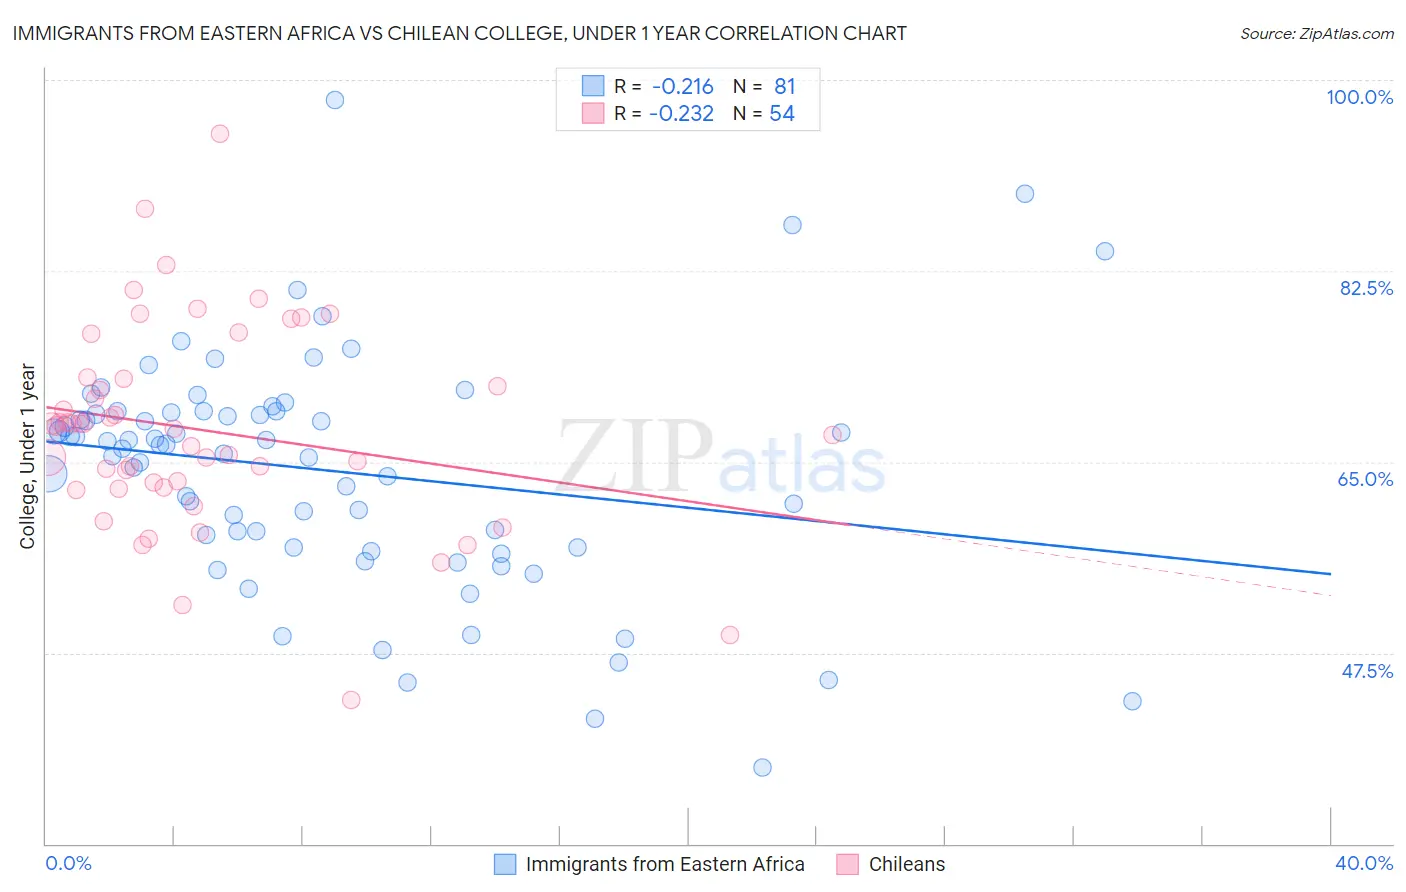
Immigrants from Eastern Africa vs Chilean College, Under 1 year Correlation Chart
The statistical analysis conducted on geographies consisting of 355,150,980 people shows a weak negative correlation between the proportion of Immigrants from Eastern Africa and percentage of population with at least college, under 1 year education in the United States with a correlation coefficient (R) of -0.216 and weighted average of 67.0%. Similarly, the statistical analysis conducted on geographies consisting of 256,681,764 people shows a weak negative correlation between the proportion of Chileans and percentage of population with at least college, under 1 year education in the United States with a correlation coefficient (R) of -0.232 and weighted average of 67.6%, a difference of 0.92%.
College, Under 1 year Correlation Summary
| Measurement | Immigrants from Eastern Africa | Chilean |
| Minimum | 37.0% | 43.2% |
| Maximum | 98.2% | 95.0% |
| Range | 61.2% | 51.9% |
| Mean | 64.2% | 67.9% |
| Median | 66.5% | 68.2% |
| Interquartile 25% (IQ1) | 57.2% | 62.7% |
| Interquartile 75% (IQ3) | 69.5% | 72.6% |
| Interquartile Range (IQR) | 12.4% | 10.0% |
| Standard Deviation (Sample) | 10.7% | 9.4% |
| Standard Deviation (Population) | 10.7% | 9.3% |
Demographics Similar to Immigrants from Eastern Africa and Chileans by College, Under 1 year
In terms of college, under 1 year, the demographic groups most similar to Immigrants from Eastern Africa are Immigrants from Syria (66.9%, a difference of 0.060%), Scottish (67.0%, a difference of 0.080%), Finnish (66.9%, a difference of 0.10%), Czech (67.1%, a difference of 0.15%), and Alsatian (67.1%, a difference of 0.22%). Similarly, the demographic groups most similar to Chileans are Basque (67.6%, a difference of 0.010%), Syrian (67.6%, a difference of 0.080%), Immigrants from Nepal (67.5%, a difference of 0.090%), Macedonian (67.6%, a difference of 0.10%), and Pakistani (67.5%, a difference of 0.11%).
| Demographics | Rating | Rank | College, Under 1 year |
| Ukrainians | 95.8 /100 | #111 | Exceptional 67.7% |
| Macedonians | 95.7 /100 | #112 | Exceptional 67.6% |
| Syrians | 95.6 /100 | #113 | Exceptional 67.6% |
| Chileans | 95.3 /100 | #114 | Exceptional 67.6% |
| Basques | 95.2 /100 | #115 | Exceptional 67.6% |
| Immigrants | Nepal | 94.9 /100 | #116 | Exceptional 67.5% |
| Pakistanis | 94.8 /100 | #117 | Exceptional 67.5% |
| Immigrants | Ukraine | 94.7 /100 | #118 | Exceptional 67.5% |
| Lebanese | 94.6 /100 | #119 | Exceptional 67.5% |
| Serbians | 93.9 /100 | #120 | Exceptional 67.4% |
| Slovenes | 93.3 /100 | #121 | Exceptional 67.3% |
| Immigrants | Jordan | 92.8 /100 | #122 | Exceptional 67.3% |
| Immigrants | Northern Africa | 92.7 /100 | #123 | Exceptional 67.2% |
| Arabs | 92.6 /100 | #124 | Exceptional 67.2% |
| Italians | 91.8 /100 | #125 | Exceptional 67.2% |
| Alsatians | 91.3 /100 | #126 | Exceptional 67.1% |
| Czechs | 90.8 /100 | #127 | Exceptional 67.1% |
| Scottish | 90.2 /100 | #128 | Exceptional 67.0% |
| Immigrants | Eastern Africa | 89.5 /100 | #129 | Excellent 67.0% |
| Immigrants | Syria | 89.0 /100 | #130 | Excellent 66.9% |
| Finns | 88.6 /100 | #131 | Excellent 66.9% |