Immigrants from Caribbean vs Asian College, 1 year or more

COMPARE

Immigrants from Caribbean
Race
Ancestry
AfghanAfricanAlaska NativeAlaskan AthabascanAlbanianAleutAlsatianAmericanApacheArabArapahoArgentineanArmenianAssyrian/Chaldean/SyriacAustralianAustrianBahamianBangladeshiBarbadianBasqueBelgianBelizeanBermudanBhutaneseBlackfeetBolivianBrazilianBritishBritish West IndianBulgarianBurmeseCajunCambodianCanadianCape VerdeanCarpatho RusynCelticCentral AmericanCentral American IndianCherokeeCheyenneChickasawChileanChineseChippewaChoctawColombianColvilleComancheCosta RicanCreeCreekCroatianCrowCubanCypriotCzechCzechoslovakianDanishDelawareDominicanDutchDutch West IndianEastern EuropeanEcuadorianEgyptianEnglishEstonianEthiopianEuropeanFijianFilipinoFinnishFrenchFrench American IndianFrench CanadianGermanGerman RussianGhanaianGreekGuamanian/ChamorroGuatemalanGuyaneseHaitianHmongHonduranHopiHoumaHungarianIcelanderIndian (Asian)IndonesianInupiatIranianIraqiIrishIroquoisIsraeliItalianJamaicanJapaneseJordanianKenyanKiowaKoreanLaotianLatvianLebaneseLiberianLithuanianLumbeeLuxembourgerMacedonianMalaysianMalteseMarshalleseMenomineeMexicanMexican American IndianMongolianMoroccanNative HawaiianNavajoNepaleseNew ZealanderNicaraguanNigerianNorthern EuropeanNorwegianOkinawanOsageOttawaPaiutePakistaniPalestinianPanamanianParaguayanPennsylvania GermanPeruvianPimaPolishPortuguesePotawatomiPuebloPuerto RicanPuget Sound SalishRomanianRussianSalvadoranSamoanScandinavianScotch-IrishScottishSeminoleSenegaleseSerbianShoshoneSierra LeoneanSiouxSlavicSlovakSloveneSomaliSouth AfricanSouth AmericanSouth American IndianSoviet UnionSpaniardSpanishSpanish AmericanSpanish American IndianSri LankanSubsaharan AfricanSudaneseSwedishSwissSyrianTaiwaneseThaiTlingit-HaidaTohono O'OdhamTonganTrinidadian and TobagonianTsimshianTurkishU.S. Virgin IslanderUgandanUkrainianUruguayanUteVenezuelanVietnameseWelshWest IndianYakamaYaquiYugoslavianYumanYup'ikZimbabwean
Immigration
NonimmigrantsImmigrantsAfghanistanAfricaAlbaniaArgentinaArmeniaAsiaAustraliaAustriaBahamasBangladeshBarbadosBelarusBelgiumBelizeBoliviaBosnia and HerzegovinaBrazilBulgariaBurma/MyanmarCabo VerdeCambodiaCameroonCanadaCaribbeanCentral AmericaChileChinaColombiaCongoCosta RicaCroatiaCubaCzechoslovakiaDenmarkDominicaDominican RepublicEastern AfricaEastern AsiaEastern EuropeEcuadorEgyptEl SalvadorEnglandEritreaEthiopiaEuropeFijiFranceGermanyGhanaGreeceGrenadaGuatemalaGuyanaHaitiHondurasHong KongHungaryIndiaIndonesiaIranIraqIrelandIsraelItalyJamaicaJapanJordanKazakhstanKenyaKoreaKuwaitLaosLatin AmericaLatviaLebanonLiberiaLithuaniaMalaysiaMexicoMicronesiaMiddle AfricaMoldovaMoroccoNepalNetherlandsNicaraguaNigeriaNorth AmericaNorth MacedoniaNorthern AfricaNorthern EuropeNorwayOceaniaPakistanPanamaPeruPhilippinesPolandPortugalRomaniaRussiaSaudi ArabiaScotlandSenegalSerbiaSierra LeoneSingaporeSomaliaSouth AfricaSouth AmericaSouth Central AsiaSouth Eastern AsiaSouthern EuropeSpainSri LankaSt. Vincent and the GrenadinesSudanSwedenSwitzerlandSyriaTaiwanThailandTrinidad and TobagoTurkeyUgandaUkraineUruguayUzbekistanVenezuelaVietnamWest IndiesWestern AfricaWestern AsiaWestern EuropeYemenZaireZimbabweAzores
Asian
Race
Ancestry
AfghanAfricanAlaska NativeAlaskan AthabascanAlbanianAleutAlsatianAmericanApacheArabArapahoArgentineanArmenianAssyrian/Chaldean/SyriacAustralianAustrianBahamianBangladeshiBarbadianBasqueBelgianBelizeanBermudanBhutaneseBlackfeetBolivianBrazilianBritishBritish West IndianBulgarianBurmeseCajunCambodianCanadianCape VerdeanCarpatho RusynCelticCentral AmericanCentral American IndianCherokeeCheyenneChickasawChileanChineseChippewaChoctawColombianColvilleComancheCosta RicanCreeCreekCroatianCrowCubanCypriotCzechCzechoslovakianDanishDelawareDominicanDutchDutch West IndianEastern EuropeanEcuadorianEgyptianEnglishEstonianEthiopianEuropeanFijianFilipinoFinnishFrenchFrench American IndianFrench CanadianGermanGerman RussianGhanaianGreekGuamanian/ChamorroGuatemalanGuyaneseHaitianHmongHonduranHopiHoumaHungarianIcelanderIndian (Asian)IndonesianInupiatIranianIraqiIrishIroquoisIsraeliItalianJamaicanJapaneseJordanianKenyanKiowaKoreanLaotianLatvianLebaneseLiberianLithuanianLumbeeLuxembourgerMacedonianMalaysianMalteseMarshalleseMenomineeMexicanMexican American IndianMongolianMoroccanNative HawaiianNavajoNepaleseNew ZealanderNicaraguanNigerianNorthern EuropeanNorwegianOkinawanOsageOttawaPaiutePakistaniPalestinianPanamanianParaguayanPennsylvania GermanPeruvianPimaPolishPortuguesePotawatomiPuebloPuerto RicanPuget Sound SalishRomanianRussianSalvadoranSamoanScandinavianScotch-IrishScottishSeminoleSenegaleseSerbianShoshoneSierra LeoneanSiouxSlavicSlovakSloveneSomaliSouth AfricanSouth AmericanSouth American IndianSoviet UnionSpaniardSpanishSpanish AmericanSpanish American IndianSri LankanSubsaharan AfricanSudaneseSwedishSwissSyrianTaiwaneseThaiTlingit-HaidaTohono O'OdhamTonganTrinidadian and TobagonianTsimshianTurkishU.S. Virgin IslanderUgandanUkrainianUruguayanUteVenezuelanVietnameseWelshWest IndianYakamaYaquiYugoslavianYumanYup'ikZimbabwean
Immigration
NonimmigrantsImmigrantsAfghanistanAfricaAlbaniaArgentinaArmeniaAsiaAustraliaAustriaBahamasBangladeshBarbadosBelarusBelgiumBelizeBoliviaBosnia and HerzegovinaBrazilBulgariaBurma/MyanmarCabo VerdeCambodiaCameroonCanadaCentral AmericaChileChinaColombiaCongoCosta RicaCroatiaCubaCzechoslovakiaDenmarkDominicaDominican RepublicEastern AfricaEastern AsiaEastern EuropeEcuadorEgyptEl SalvadorEnglandEritreaEthiopiaEuropeFijiFranceGermanyGhanaGreeceGrenadaGuatemalaGuyanaHaitiHondurasHong KongHungaryIndiaIndonesiaIranIraqIrelandIsraelItalyJamaicaJapanJordanKazakhstanKenyaKoreaKuwaitLaosLatin AmericaLatviaLebanonLiberiaLithuaniaMalaysiaMexicoMicronesiaMiddle AfricaMoldovaMoroccoNepalNetherlandsNicaraguaNigeriaNorth AmericaNorth MacedoniaNorthern AfricaNorthern EuropeNorwayOceaniaPakistanPanamaPeruPhilippinesPolandPortugalRomaniaRussiaSaudi ArabiaScotlandSenegalSerbiaSierra LeoneSingaporeSomaliaSouth AfricaSouth AmericaSouth Central AsiaSouth Eastern AsiaSouthern EuropeSpainSri LankaSt. Vincent and the GrenadinesSudanSwedenSwitzerlandSyriaTaiwanThailandTrinidad and TobagoTurkeyUgandaUkraineUruguayUzbekistanVenezuelaVietnamWest IndiesWestern AfricaWestern AsiaWestern EuropeYemenZaireZimbabweAzores
College, 1 year or more
Income
Poverty
Unemployment
Labor Participation
Family Structure
Vehicle Availability
Education Level
Disability

College, 1 year or more Comparison

Immigrants from Caribbean

Asians

Tragic
Exceptional
51.4%
COLLEGE, 1 YEAR OR MORE
0.0/ 100
METRIC RATING
313th/ 347
METRIC RANK
64.2%
COLLEGE, 1 YEAR OR MORE
99.8/ 100
METRIC RATING
53rd/ 347
METRIC RANK

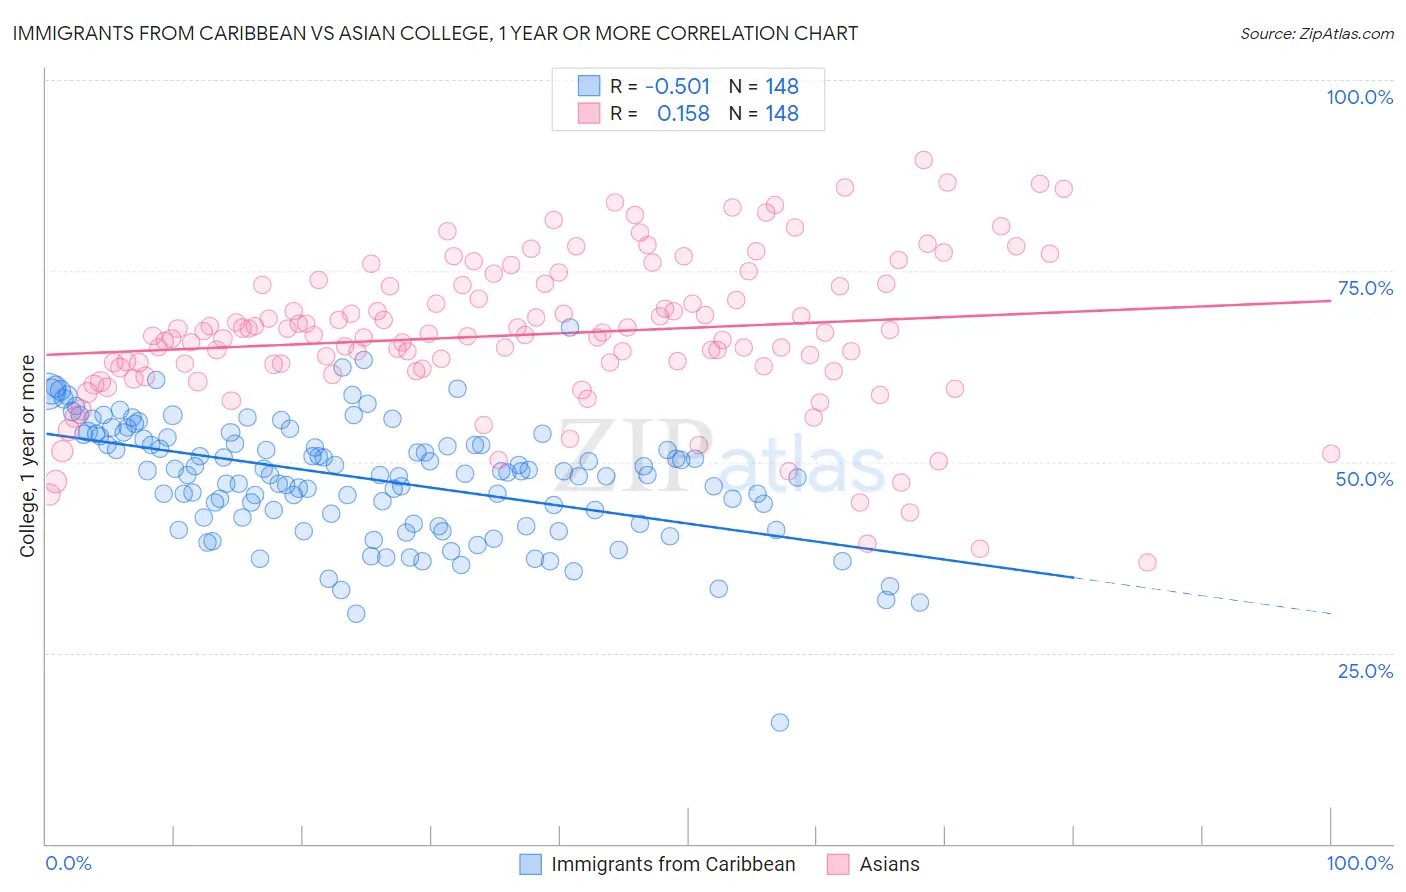
Immigrants from Caribbean vs Asian College, 1 year or more Correlation Chart

The statistical analysis conducted on geographies consisting of 450,060,902 people shows a substantial negative correlation between the proportion of Immigrants from Caribbean and percentage of population with at least college, 1 year or more education in the United States with a correlation coefficient (R) of -0.501 and weighted average of 51.4%. Similarly, the statistical analysis conducted on geographies consisting of 550,911,104 people shows a poor positive correlation between the proportion of Asians and percentage of population with at least college, 1 year or more education in the United States with a correlation coefficient (R) of 0.158 and weighted average of 64.2%, a difference of 24.8%.
Immigrants from Caribbean vs Asian College, 1 year or more

College, 1 year or more Correlation Summary

MeasurementImmigrants from CaribbeanAsian
Minimum15.9%36.8%
Maximum67.7%89.5%
Range51.8%52.7%
Mean47.8%66.7%
Median48.6%66.6%
Interquartile 25% (IQ1)42.7%62.3%
Interquartile 75% (IQ3)53.3%73.1%
Interquartile Range (IQR)10.6%10.9%
Standard Deviation (Sample)7.8%10.0%
Standard Deviation (Population)7.7%10.0%

Similar Demographics by College, 1 year or more

Demographics Similar to Immigrants from Caribbean by College, 1 year or more

In terms of college, 1 year or more, the demographic groups most similar to Immigrants from Caribbean are Pueblo (51.5%, a difference of 0.13%), Immigrants from Haiti (51.5%, a difference of 0.17%), Fijian (51.3%, a difference of 0.22%), Honduran (51.6%, a difference of 0.33%), and Guatemalan (51.2%, a difference of 0.45%).
DemographicsRating | RankCollege, 1 year or more
Mexican American Indians
0.0
/100
|
#306
Tragic
51.9%
Immigrants | Portugal
0.0
/100
|
#307
Tragic
51.9%
Salvadorans
0.0
/100
|
#308
Tragic
51.8%
Apache
0.0
/100
|
#309
Tragic
51.8%
Hondurans
0.0
/100
|
#310
Tragic
51.6%
Immigrants | Haiti
0.0
/100
|
#311
Tragic
51.5%
Pueblo
0.0
/100
|
#312
Tragic
51.5%
Immigrants | Caribbean
0.0
/100
|
#313
Tragic
51.4%
Fijians
0.0
/100
|
#314
Tragic
51.3%
Guatemalans
0.0
/100
|
#315
Tragic
51.2%
Cajuns
0.0
/100
|
#316
Tragic
51.2%
Hispanics or Latinos
0.0
/100
|
#317
Tragic
51.1%
Immigrants | Honduras
0.0
/100
|
#318
Tragic
51.0%
Immigrants | El Salvador
0.0
/100
|
#319
Tragic
51.0%
Kiowa
0.0
/100
|
#320
Tragic
51.0%

Demographics Similar to Asians by College, 1 year or more

In terms of college, 1 year or more, the demographic groups most similar to Asians are Immigrants from Netherlands (64.2%, a difference of 0.020%), Zimbabwean (64.2%, a difference of 0.030%), Immigrants from Belarus (64.1%, a difference of 0.15%), Immigrants from Czechoslovakia (64.1%, a difference of 0.17%), and Immigrants from Malaysia (64.3%, a difference of 0.18%).
DemographicsRating | RankCollege, 1 year or more
Bhutanese
99.9
/100
|
#46
Exceptional
64.6%
Australians
99.9
/100
|
#47
Exceptional
64.6%
Immigrants | Bulgaria
99.9
/100
|
#48
Exceptional
64.6%
New Zealanders
99.9
/100
|
#49
Exceptional
64.6%
Immigrants | Austria
99.8
/100
|
#50
Exceptional
64.4%
Immigrants | Malaysia
99.8
/100
|
#51
Exceptional
64.3%
Immigrants | Netherlands
99.8
/100
|
#52
Exceptional
64.2%
Asians
99.8
/100
|
#53
Exceptional
64.2%
Zimbabweans
99.8
/100
|
#54
Exceptional
64.2%
Immigrants | Belarus
99.7
/100
|
#55
Exceptional
64.1%
Immigrants | Czechoslovakia
99.7
/100
|
#56
Exceptional
64.1%
South Africans
99.7
/100
|
#57
Exceptional
64.1%
Immigrants | Asia
99.7
/100
|
#58
Exceptional
64.0%
Immigrants | Serbia
99.6
/100
|
#59
Exceptional
63.8%
Immigrants | Kazakhstan
99.5
/100
|
#60
Exceptional
63.6%