English vs Immigrants from Chile College, 1 year or more

COMPARE

English
Race
Ancestry
AfghanAfricanAlaska NativeAlaskan AthabascanAlbanianAleutAlsatianAmericanApacheArabArapahoArgentineanArmenianAssyrian/Chaldean/SyriacAustralianAustrianBahamianBangladeshiBarbadianBasqueBelgianBelizeanBermudanBhutaneseBlackfeetBolivianBrazilianBritishBritish West IndianBulgarianBurmeseCajunCambodianCanadianCape VerdeanCarpatho RusynCelticCentral AmericanCentral American IndianCherokeeCheyenneChickasawChileanChineseChippewaChoctawColombianColvilleComancheCosta RicanCreeCreekCroatianCrowCubanCypriotCzechCzechoslovakianDanishDelawareDominicanDutchDutch West IndianEastern EuropeanEcuadorianEgyptianEnglishEstonianEthiopianEuropeanFijianFilipinoFinnishFrenchFrench American IndianFrench CanadianGermanGerman RussianGhanaianGreekGuamanian/ChamorroGuatemalanGuyaneseHaitianHmongHonduranHopiHoumaHungarianIcelanderIndian (Asian)IndonesianInupiatIranianIraqiIrishIroquoisIsraeliItalianJamaicanJapaneseJordanianKenyanKiowaKoreanLaotianLatvianLebaneseLiberianLithuanianLumbeeLuxembourgerMacedonianMalaysianMalteseMarshalleseMenomineeMexicanMexican American IndianMongolianMoroccanNative HawaiianNavajoNepaleseNew ZealanderNicaraguanNigerianNorthern EuropeanNorwegianOkinawanOsageOttawaPaiutePakistaniPalestinianPanamanianParaguayanPennsylvania GermanPeruvianPimaPolishPortuguesePotawatomiPuebloPuerto RicanPuget Sound SalishRomanianRussianSalvadoranSamoanScandinavianScotch-IrishScottishSeminoleSenegaleseSerbianShoshoneSierra LeoneanSiouxSlavicSlovakSloveneSomaliSouth AfricanSouth AmericanSouth American IndianSoviet UnionSpaniardSpanishSpanish AmericanSpanish American IndianSri LankanSubsaharan AfricanSudaneseSwedishSwissSyrianTaiwaneseThaiTlingit-HaidaTohono O'OdhamTonganTrinidadian and TobagonianTsimshianTurkishU.S. Virgin IslanderUgandanUkrainianUruguayanUteVenezuelanVietnameseWelshWest IndianYakamaYaquiYugoslavianYumanYup'ikZimbabwean
Immigration
NonimmigrantsImmigrantsAfghanistanAfricaAlbaniaArgentinaArmeniaAsiaAustraliaAustriaBahamasBangladeshBarbadosBelarusBelgiumBelizeBoliviaBosnia and HerzegovinaBrazilBulgariaBurma/MyanmarCabo VerdeCambodiaCameroonCanadaCaribbeanCentral AmericaChinaColombiaCongoCosta RicaCroatiaCubaCzechoslovakiaDenmarkDominicaDominican RepublicEastern AfricaEastern AsiaEastern EuropeEcuadorEgyptEl SalvadorEnglandEritreaEthiopiaEuropeFijiFranceGermanyGhanaGreeceGrenadaGuatemalaGuyanaHaitiHondurasHong KongHungaryIndiaIndonesiaIranIraqIrelandIsraelItalyJamaicaJapanJordanKazakhstanKenyaKoreaKuwaitLaosLatin AmericaLatviaLebanonLiberiaLithuaniaMalaysiaMexicoMicronesiaMiddle AfricaMoldovaMoroccoNepalNetherlandsNicaraguaNigeriaNorth AmericaNorth MacedoniaNorthern AfricaNorthern EuropeNorwayOceaniaPakistanPanamaPeruPhilippinesPolandPortugalRomaniaRussiaSaudi ArabiaScotlandSenegalSerbiaSierra LeoneSingaporeSomaliaSouth AfricaSouth AmericaSouth Central AsiaSouth Eastern AsiaSouthern EuropeSpainSri LankaSt. Vincent and the GrenadinesSudanSwedenSwitzerlandSyriaTaiwanThailandTrinidad and TobagoTurkeyUgandaUkraineUruguayUzbekistanVenezuelaVietnamWest IndiesWestern AfricaWestern AsiaWestern EuropeYemenZaireZimbabweAzores
Immigrants from Chile
Race
Ancestry
AfghanAfricanAlaska NativeAlaskan AthabascanAlbanianAleutAlsatianAmericanApacheArabArapahoArgentineanArmenianAssyrian/Chaldean/SyriacAustralianAustrianBahamianBangladeshiBarbadianBasqueBelgianBelizeanBermudanBhutaneseBlackfeetBolivianBrazilianBritishBritish West IndianBulgarianBurmeseCajunCambodianCanadianCape VerdeanCarpatho RusynCelticCentral AmericanCentral American IndianCherokeeCheyenneChickasawChileanChineseChippewaChoctawColombianColvilleComancheCosta RicanCreeCreekCroatianCrowCubanCypriotCzechCzechoslovakianDanishDelawareDominicanDutchDutch West IndianEastern EuropeanEcuadorianEgyptianEstonianEthiopianEuropeanFijianFilipinoFinnishFrenchFrench American IndianFrench CanadianGermanGerman RussianGhanaianGreekGuamanian/ChamorroGuatemalanGuyaneseHaitianHmongHonduranHopiHoumaHungarianIcelanderIndian (Asian)IndonesianInupiatIranianIraqiIrishIroquoisIsraeliItalianJamaicanJapaneseJordanianKenyanKiowaKoreanLaotianLatvianLebaneseLiberianLithuanianLumbeeLuxembourgerMacedonianMalaysianMalteseMarshalleseMenomineeMexicanMexican American IndianMongolianMoroccanNative HawaiianNavajoNepaleseNew ZealanderNicaraguanNigerianNorthern EuropeanNorwegianOkinawanOsageOttawaPaiutePakistaniPalestinianPanamanianParaguayanPennsylvania GermanPeruvianPimaPolishPortuguesePotawatomiPuebloPuerto RicanPuget Sound SalishRomanianRussianSalvadoranSamoanScandinavianScotch-IrishScottishSeminoleSenegaleseSerbianShoshoneSierra LeoneanSiouxSlavicSlovakSloveneSomaliSouth AfricanSouth AmericanSouth American IndianSoviet UnionSpaniardSpanishSpanish AmericanSpanish American IndianSri LankanSubsaharan AfricanSudaneseSwedishSwissSyrianTaiwaneseThaiTlingit-HaidaTohono O'OdhamTonganTrinidadian and TobagonianTsimshianTurkishU.S. Virgin IslanderUgandanUkrainianUruguayanUteVenezuelanVietnameseWelshWest IndianYakamaYaquiYugoslavianYumanYup'ikZimbabwean
Immigration
NonimmigrantsImmigrantsAfghanistanAfricaAlbaniaArgentinaArmeniaAsiaAustraliaAustriaBahamasBangladeshBarbadosBelarusBelgiumBelizeBoliviaBosnia and HerzegovinaBrazilBulgariaBurma/MyanmarCabo VerdeCambodiaCameroonCanadaCaribbeanCentral AmericaChileChinaColombiaCongoCosta RicaCroatiaCubaCzechoslovakiaDenmarkDominicaDominican RepublicEastern AfricaEastern AsiaEastern EuropeEcuadorEgyptEl SalvadorEnglandEritreaEthiopiaEuropeFijiFranceGermanyGhanaGreeceGrenadaGuatemalaGuyanaHaitiHondurasHong KongHungaryIndiaIndonesiaIranIraqIrelandIsraelItalyJamaicaJapanJordanKazakhstanKenyaKoreaKuwaitLaosLatin AmericaLatviaLebanonLiberiaLithuaniaMalaysiaMexicoMicronesiaMiddle AfricaMoldovaMoroccoNepalNetherlandsNicaraguaNigeriaNorth AmericaNorth MacedoniaNorthern AfricaNorthern EuropeNorwayOceaniaPakistanPanamaPeruPhilippinesPolandPortugalRomaniaRussiaSaudi ArabiaScotlandSenegalSerbiaSierra LeoneSingaporeSomaliaSouth AfricaSouth AmericaSouth Central AsiaSouth Eastern AsiaSouthern EuropeSpainSri LankaSt. Vincent and the GrenadinesSudanSwedenSwitzerlandSyriaTaiwanThailandTrinidad and TobagoTurkeyUgandaUkraineUruguayUzbekistanVenezuelaVietnamWest IndiesWestern AfricaWestern AsiaWestern EuropeYemenZaireZimbabweAzores
College, 1 year or more
Income
Poverty
Unemployment
Labor Participation
Family Structure
Vehicle Availability
Education Level
Disability

College, 1 year or more Comparison

English

Immigrants from Chile

Good
Exceptional
60.0%
COLLEGE, 1 YEAR OR MORE
67.2/ 100
METRIC RATING
158th/ 347
METRIC RANK
61.4%
COLLEGE, 1 YEAR OR MORE
92.3/ 100
METRIC RATING
122nd/ 347
METRIC RANK

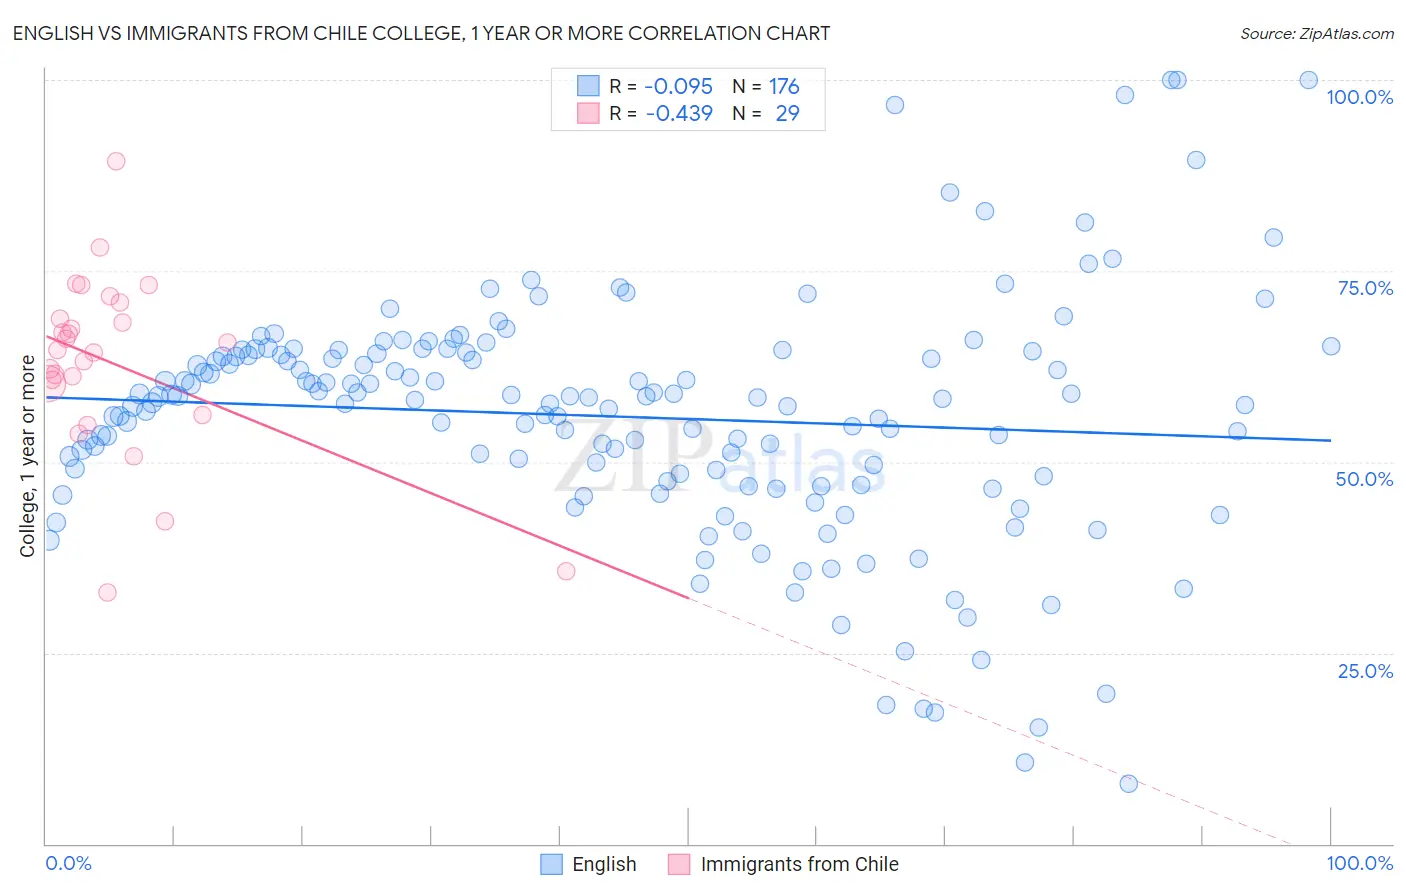
English vs Immigrants from Chile College, 1 year or more Correlation Chart

The statistical analysis conducted on geographies consisting of 579,957,546 people shows a slight negative correlation between the proportion of English and percentage of population with at least college, 1 year or more education in the United States with a correlation coefficient (R) of -0.095 and weighted average of 60.0%. Similarly, the statistical analysis conducted on geographies consisting of 218,647,266 people shows a moderate negative correlation between the proportion of Immigrants from Chile and percentage of population with at least college, 1 year or more education in the United States with a correlation coefficient (R) of -0.439 and weighted average of 61.4%, a difference of 2.3%.
English vs Immigrants from Chile College, 1 year or more

College, 1 year or more Correlation Summary

MeasurementEnglishImmigrants from Chile
Minimum7.9%32.9%
Maximum100.0%89.4%
Range92.1%56.5%
Mean55.9%62.9%
Median58.3%64.7%
Interquartile 25% (IQ1)47.8%58.2%
Interquartile 75% (IQ3)64.2%69.8%
Interquartile Range (IQR)16.4%11.7%
Standard Deviation (Sample)15.8%11.9%
Standard Deviation (Population)15.8%11.7%

Similar Demographics by College, 1 year or more

Demographics Similar to English by College, 1 year or more

In terms of college, 1 year or more, the demographic groups most similar to English are Immigrants from Iraq (60.0%, a difference of 0.010%), South American Indian (60.0%, a difference of 0.020%), Immigrants from Armenia (60.0%, a difference of 0.10%), Somali (59.9%, a difference of 0.15%), and Sudanese (60.2%, a difference of 0.36%).
DemographicsRating | RankCollege, 1 year or more
Albanians
77.8
/100
|
#151
Good
60.4%
Immigrants | Germany
76.1
/100
|
#152
Good
60.3%
Sierra Leoneans
74.1
/100
|
#153
Good
60.2%
Sudanese
73.0
/100
|
#154
Good
60.2%
Moroccans
72.9
/100
|
#155
Good
60.2%
Finns
72.9
/100
|
#156
Good
60.2%
Immigrants | Armenia
68.8
/100
|
#157
Good
60.0%
English
67.2
/100
|
#158
Good
60.0%
Immigrants | Iraq
67.0
/100
|
#159
Good
60.0%
South American Indians
66.9
/100
|
#160
Good
60.0%
Somalis
64.5
/100
|
#161
Good
59.9%
Koreans
58.5
/100
|
#162
Average
59.7%
Immigrants | Somalia
58.3
/100
|
#163
Average
59.7%
Belgians
58.1
/100
|
#164
Average
59.7%
Irish
56.1
/100
|
#165
Average
59.6%

Demographics Similar to Immigrants from Chile by College, 1 year or more

In terms of college, 1 year or more, the demographic groups most similar to Immigrants from Chile are Serbian (61.4%, a difference of 0.010%), Venezuelan (61.3%, a difference of 0.040%), Immigrants from Jordan (61.4%, a difference of 0.080%), Immigrants from Syria (61.3%, a difference of 0.12%), and Alsatian (61.3%, a difference of 0.16%).
DemographicsRating | RankCollege, 1 year or more
Norwegians
94.5
/100
|
#115
Exceptional
61.7%
Lebanese
94.1
/100
|
#116
Exceptional
61.6%
Arabs
93.9
/100
|
#117
Exceptional
61.6%
Immigrants | Brazil
93.9
/100
|
#118
Exceptional
61.6%
Assyrians/Chaldeans/Syriacs
93.3
/100
|
#119
Exceptional
61.5%
Pakistanis
93.2
/100
|
#120
Exceptional
61.5%
Immigrants | Jordan
92.7
/100
|
#121
Exceptional
61.4%
Immigrants | Chile
92.3
/100
|
#122
Exceptional
61.4%
Serbians
92.2
/100
|
#123
Exceptional
61.4%
Venezuelans
92.1
/100
|
#124
Exceptional
61.3%
Immigrants | Syria
91.6
/100
|
#125
Exceptional
61.3%
Alsatians
91.3
/100
|
#126
Exceptional
61.3%
Immigrants | Eastern Africa
91.1
/100
|
#127
Exceptional
61.2%
Immigrants | Italy
91.1
/100
|
#128
Exceptional
61.2%
Ugandans
90.7
/100
|
#129
Exceptional
61.2%