Dutch vs Navajo No Schooling Completed
COMPARE
Dutch
Navajo
No Schooling Completed
No Schooling Completed Comparison
Dutch
Navajo
1.4%
NO SCHOOLING COMPLETED
100.0/ 100
METRIC RATING
10th/ 347
METRIC RANK
2.1%
NO SCHOOLING COMPLETED
36.5/ 100
METRIC RATING
187th/ 347
METRIC RANK
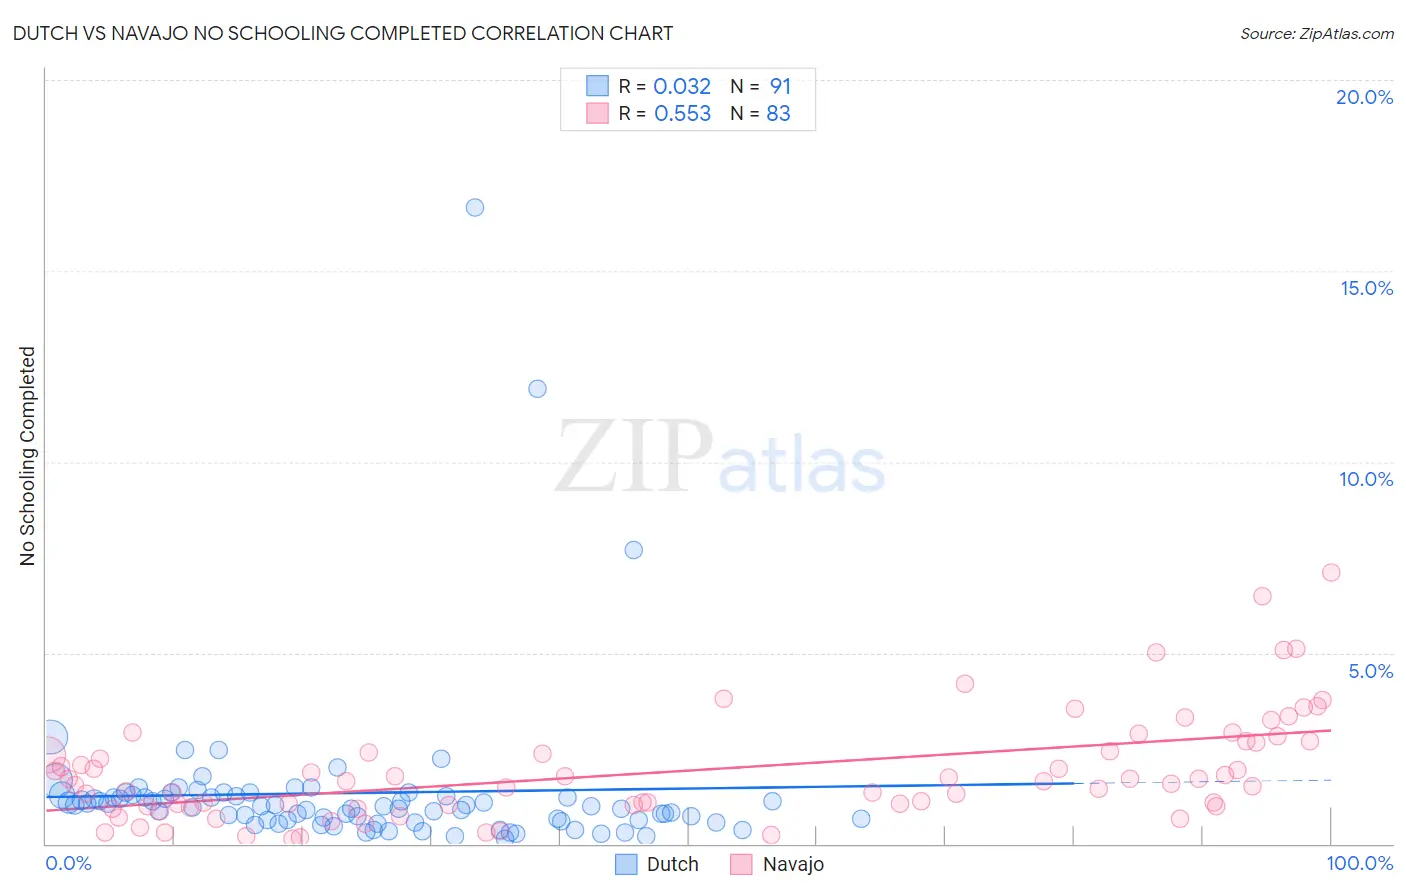
Dutch vs Navajo No Schooling Completed Correlation Chart
The statistical analysis conducted on geographies consisting of 537,646,612 people shows no correlation between the proportion of Dutch and percentage of population with no schooling in the United States with a correlation coefficient (R) of 0.032 and weighted average of 1.4%. Similarly, the statistical analysis conducted on geographies consisting of 223,187,945 people shows a substantial positive correlation between the proportion of Navajo and percentage of population with no schooling in the United States with a correlation coefficient (R) of 0.553 and weighted average of 2.1%, a difference of 49.5%.
No Schooling Completed Correlation Summary
| Measurement | Dutch | Navajo |
| Minimum | 0.12% | 0.14% |
| Maximum | 16.7% | 7.1% |
| Range | 16.5% | 7.0% |
| Mean | 1.3% | 1.9% |
| Median | 0.97% | 1.6% |
| Interquartile 25% (IQ1) | 0.62% | 0.99% |
| Interquartile 75% (IQ3) | 1.3% | 2.6% |
| Interquartile Range (IQR) | 0.63% | 1.7% |
| Standard Deviation (Sample) | 2.2% | 1.4% |
| Standard Deviation (Population) | 2.2% | 1.4% |
Similar Demographics by No Schooling Completed
Demographics Similar to Dutch by No Schooling Completed
In terms of no schooling completed, the demographic groups most similar to Dutch are Scottish (1.4%, a difference of 0.80%), Lithuanian (1.4%, a difference of 0.84%), Irish (1.4%, a difference of 0.86%), Polish (1.4%, a difference of 0.89%), and Swedish (1.4%, a difference of 1.3%).
| Demographics | Rating | Rank | No Schooling Completed |
| Norwegians | 100.0 /100 | #3 | Exceptional 1.3% |
| Germans | 100.0 /100 | #4 | Exceptional 1.4% |
| Slovenes | 100.0 /100 | #5 | Exceptional 1.4% |
| Carpatho Rusyns | 100.0 /100 | #6 | Exceptional 1.4% |
| English | 100.0 /100 | #7 | Exceptional 1.4% |
| Swedes | 100.0 /100 | #8 | Exceptional 1.4% |
| Scottish | 100.0 /100 | #9 | Exceptional 1.4% |
| Dutch | 100.0 /100 | #10 | Exceptional 1.4% |
| Lithuanians | 100.0 /100 | #11 | Exceptional 1.4% |
| Irish | 100.0 /100 | #12 | Exceptional 1.4% |
| Poles | 100.0 /100 | #13 | Exceptional 1.4% |
| Scotch-Irish | 100.0 /100 | #14 | Exceptional 1.5% |
| Tlingit-Haida | 100.0 /100 | #15 | Exceptional 1.5% |
| Finns | 100.0 /100 | #16 | Exceptional 1.5% |
| Croatians | 100.0 /100 | #17 | Exceptional 1.5% |
Demographics Similar to Navajo by No Schooling Completed
In terms of no schooling completed, the demographic groups most similar to Navajo are Immigrants from Kenya (2.1%, a difference of 0.050%), Immigrants from Egypt (2.1%, a difference of 0.060%), Immigrants from Bosnia and Herzegovina (2.1%, a difference of 0.30%), Spanish American (2.1%, a difference of 0.57%), and Mongolian (2.1%, a difference of 0.60%).
| Demographics | Rating | Rank | No Schooling Completed |
| Portuguese | 43.9 /100 | #180 | Average 2.1% |
| Immigrants | Taiwan | 42.6 /100 | #181 | Average 2.1% |
| French American Indians | 42.2 /100 | #182 | Average 2.1% |
| Blacks/African Americans | 41.4 /100 | #183 | Average 2.1% |
| Pima | 41.3 /100 | #184 | Average 2.1% |
| Mongolians | 40.8 /100 | #185 | Average 2.1% |
| Immigrants | Bosnia and Herzegovina | 38.6 /100 | #186 | Fair 2.1% |
| Navajo | 36.5 /100 | #187 | Fair 2.1% |
| Immigrants | Kenya | 36.2 /100 | #188 | Fair 2.1% |
| Immigrants | Egypt | 36.1 /100 | #189 | Fair 2.1% |
| Spanish Americans | 32.6 /100 | #190 | Fair 2.1% |
| Bermudans | 30.7 /100 | #191 | Fair 2.1% |
| Guamanians/Chamorros | 29.8 /100 | #192 | Fair 2.2% |
| Paraguayans | 29.3 /100 | #193 | Fair 2.2% |
| Immigrants | Albania | 28.3 /100 | #194 | Fair 2.2% |