Canadian vs Immigrants from Brazil College, 1 year or more
COMPARE
Canadian
Immigrants from Brazil
College, 1 year or more
College, 1 year or more Comparison
Canadians
Immigrants from Brazil
60.6%
COLLEGE, 1 YEAR OR MORE
82.7/ 100
METRIC RATING
143rd/ 347
METRIC RANK
61.6%
COLLEGE, 1 YEAR OR MORE
93.9/ 100
METRIC RATING
118th/ 347
METRIC RANK
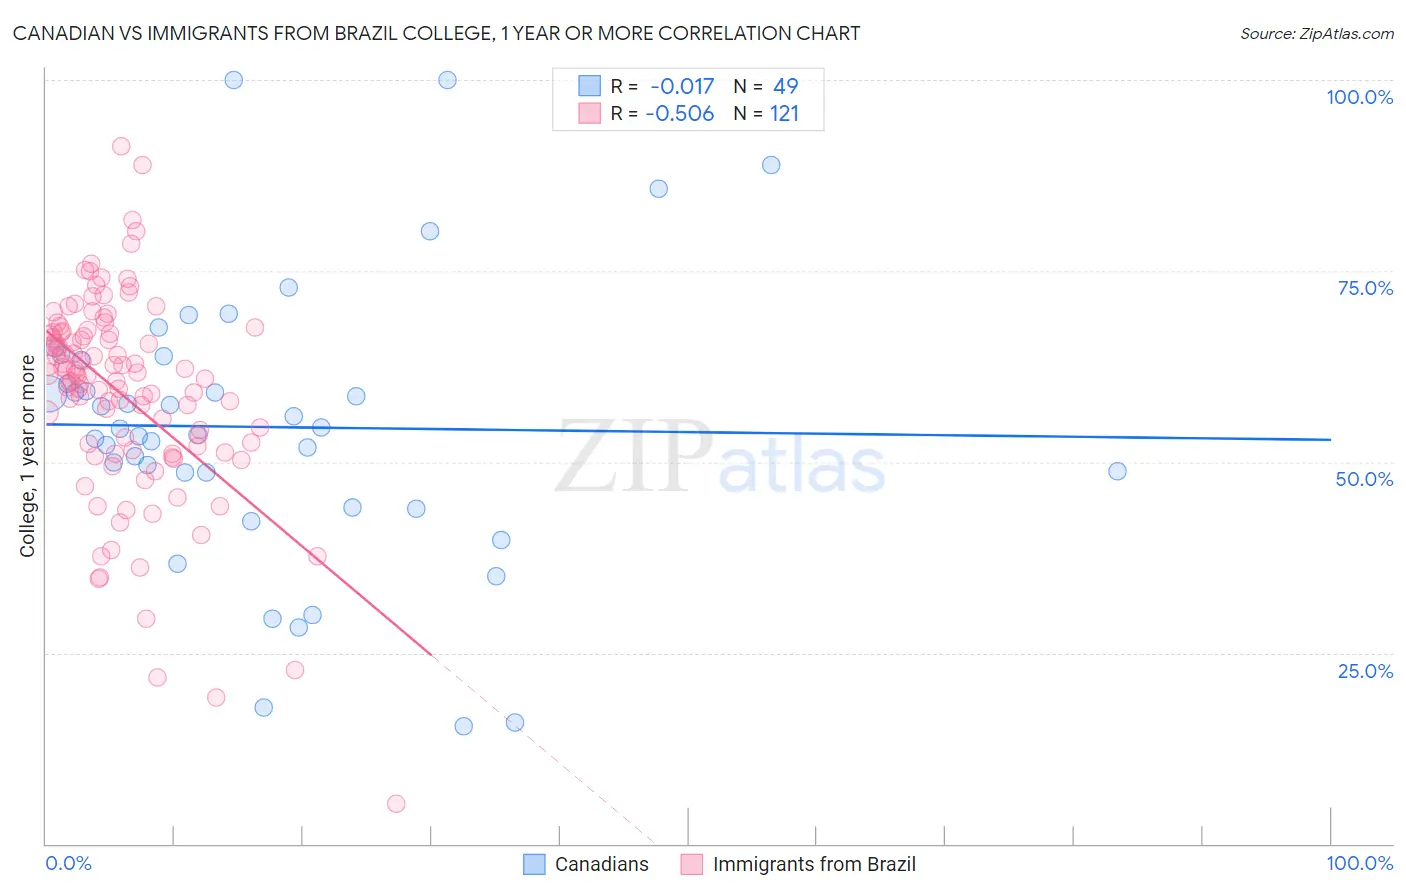
Canadian vs Immigrants from Brazil College, 1 year or more Correlation Chart
The statistical analysis conducted on geographies consisting of 437,551,933 people shows no correlation between the proportion of Canadians and percentage of population with at least college, 1 year or more education in the United States with a correlation coefficient (R) of -0.017 and weighted average of 60.6%. Similarly, the statistical analysis conducted on geographies consisting of 343,021,697 people shows a substantial negative correlation between the proportion of Immigrants from Brazil and percentage of population with at least college, 1 year or more education in the United States with a correlation coefficient (R) of -0.506 and weighted average of 61.6%, a difference of 1.5%.
College, 1 year or more Correlation Summary
| Measurement | Canadian | Immigrants from Brazil |
| Minimum | 15.4% | 5.3% |
| Maximum | 100.0% | 91.3% |
| Range | 84.6% | 86.0% |
| Mean | 54.6% | 58.8% |
| Median | 54.3% | 61.4% |
| Interquartile 25% (IQ1) | 46.3% | 51.8% |
| Interquartile 75% (IQ3) | 63.6% | 66.8% |
| Interquartile Range (IQR) | 17.4% | 15.0% |
| Standard Deviation (Sample) | 18.4% | 13.5% |
| Standard Deviation (Population) | 18.2% | 13.4% |
Similar Demographics by College, 1 year or more
Demographics Similar to Canadians by College, 1 year or more
In terms of college, 1 year or more, the demographic groups most similar to Canadians are Polish (60.7%, a difference of 0.010%), Immigrants from Afghanistan (60.7%, a difference of 0.040%), Iraqi (60.7%, a difference of 0.050%), Czech (60.6%, a difference of 0.080%), and Slavic (60.6%, a difference of 0.14%).
| Demographics | Rating | Rank | College, 1 year or more |
| Basques | 87.2 /100 | #136 | Excellent 60.9% |
| Slovenes | 86.5 /100 | #137 | Excellent 60.9% |
| Taiwanese | 84.3 /100 | #138 | Excellent 60.7% |
| Immigrants | Eritrea | 84.3 /100 | #139 | Excellent 60.7% |
| Iraqis | 83.3 /100 | #140 | Excellent 60.7% |
| Immigrants | Afghanistan | 83.1 /100 | #141 | Excellent 60.7% |
| Poles | 82.8 /100 | #142 | Excellent 60.7% |
| Canadians | 82.7 /100 | #143 | Excellent 60.6% |
| Czechs | 81.9 /100 | #144 | Excellent 60.6% |
| Slavs | 81.1 /100 | #145 | Excellent 60.6% |
| Scottish | 80.2 /100 | #146 | Excellent 60.5% |
| Immigrants | Kenya | 79.1 /100 | #147 | Good 60.5% |
| Kenyans | 79.0 /100 | #148 | Good 60.5% |
| Brazilians | 79.0 /100 | #149 | Good 60.5% |
| Immigrants | Sudan | 77.8 /100 | #150 | Good 60.4% |
Demographics Similar to Immigrants from Brazil by College, 1 year or more
In terms of college, 1 year or more, the demographic groups most similar to Immigrants from Brazil are Arab (61.6%, a difference of 0.0%), Lebanese (61.6%, a difference of 0.050%), Assyrian/Chaldean/Syriac (61.5%, a difference of 0.13%), Pakistani (61.5%, a difference of 0.14%), and Norwegian (61.7%, a difference of 0.15%).
| Demographics | Rating | Rank | College, 1 year or more |
| Macedonians | 95.6 /100 | #111 | Exceptional 61.8% |
| Austrians | 95.4 /100 | #112 | Exceptional 61.8% |
| Ukrainians | 95.2 /100 | #113 | Exceptional 61.8% |
| Danes | 94.8 /100 | #114 | Exceptional 61.7% |
| Norwegians | 94.5 /100 | #115 | Exceptional 61.7% |
| Lebanese | 94.1 /100 | #116 | Exceptional 61.6% |
| Arabs | 93.9 /100 | #117 | Exceptional 61.6% |
| Immigrants | Brazil | 93.9 /100 | #118 | Exceptional 61.6% |
| Assyrians/Chaldeans/Syriacs | 93.3 /100 | #119 | Exceptional 61.5% |
| Pakistanis | 93.2 /100 | #120 | Exceptional 61.5% |
| Immigrants | Jordan | 92.7 /100 | #121 | Exceptional 61.4% |
| Immigrants | Chile | 92.3 /100 | #122 | Exceptional 61.4% |
| Serbians | 92.2 /100 | #123 | Exceptional 61.4% |
| Venezuelans | 92.1 /100 | #124 | Exceptional 61.3% |
| Immigrants | Syria | 91.6 /100 | #125 | Exceptional 61.3% |