Burmese vs Immigrants from Bahamas GED/Equivalency

COMPARE

Burmese
Race
Ancestry
AfghanAfricanAlaska NativeAlaskan AthabascanAlbanianAleutAlsatianAmericanApacheArabArapahoArgentineanArmenianAssyrian/Chaldean/SyriacAustralianAustrianBahamianBangladeshiBarbadianBasqueBelgianBelizeanBermudanBhutaneseBlackfeetBolivianBrazilianBritishBritish West IndianBulgarianBurmeseCajunCambodianCanadianCape VerdeanCarpatho RusynCelticCentral AmericanCentral American IndianCherokeeCheyenneChickasawChileanChineseChippewaChoctawColombianColvilleComancheCosta RicanCreeCreekCroatianCrowCubanCypriotCzechCzechoslovakianDanishDelawareDominicanDutchDutch West IndianEastern EuropeanEcuadorianEgyptianEnglishEstonianEthiopianEuropeanFijianFilipinoFinnishFrenchFrench American IndianFrench CanadianGermanGerman RussianGhanaianGreekGuamanian/ChamorroGuatemalanGuyaneseHaitianHmongHonduranHopiHoumaHungarianIcelanderIndian (Asian)IndonesianInupiatIranianIraqiIrishIroquoisIsraeliItalianJamaicanJapaneseJordanianKenyanKiowaKoreanLaotianLatvianLebaneseLiberianLithuanianLumbeeLuxembourgerMacedonianMalaysianMalteseMarshalleseMenomineeMexicanMexican American IndianMongolianMoroccanNative HawaiianNavajoNepaleseNew ZealanderNicaraguanNigerianNorthern EuropeanNorwegianOkinawanOsageOttawaPaiutePakistaniPalestinianPanamanianParaguayanPennsylvania GermanPeruvianPimaPolishPortuguesePotawatomiPuebloPuerto RicanPuget Sound SalishRomanianRussianSalvadoranSamoanScandinavianScotch-IrishScottishSeminoleSenegaleseSerbianShoshoneSierra LeoneanSiouxSlavicSlovakSloveneSomaliSouth AfricanSouth AmericanSouth American IndianSoviet UnionSpaniardSpanishSpanish AmericanSpanish American IndianSri LankanSubsaharan AfricanSudaneseSwedishSwissSyrianTaiwaneseThaiTlingit-HaidaTohono O'OdhamTonganTrinidadian and TobagonianTsimshianTurkishU.S. Virgin IslanderUgandanUkrainianUruguayanUteVenezuelanVietnameseWelshWest IndianYakamaYaquiYugoslavianYumanYup'ikZimbabwean
Immigration
NonimmigrantsImmigrantsAfghanistanAfricaAlbaniaArgentinaArmeniaAsiaAustraliaAustriaBangladeshBarbadosBelarusBelgiumBelizeBoliviaBosnia and HerzegovinaBrazilBulgariaBurma/MyanmarCabo VerdeCambodiaCameroonCanadaCaribbeanCentral AmericaChileChinaColombiaCongoCosta RicaCroatiaCubaCzechoslovakiaDenmarkDominicaDominican RepublicEastern AfricaEastern AsiaEastern EuropeEcuadorEgyptEl SalvadorEnglandEritreaEthiopiaEuropeFijiFranceGermanyGhanaGreeceGrenadaGuatemalaGuyanaHaitiHondurasHong KongHungaryIndiaIndonesiaIranIraqIrelandIsraelItalyJamaicaJapanJordanKazakhstanKenyaKoreaKuwaitLaosLatin AmericaLatviaLebanonLiberiaLithuaniaMalaysiaMexicoMicronesiaMiddle AfricaMoldovaMoroccoNepalNetherlandsNicaraguaNigeriaNorth AmericaNorth MacedoniaNorthern AfricaNorthern EuropeNorwayOceaniaPakistanPanamaPeruPhilippinesPolandPortugalRomaniaRussiaSaudi ArabiaScotlandSenegalSerbiaSierra LeoneSingaporeSomaliaSouth AfricaSouth AmericaSouth Central AsiaSouth Eastern AsiaSouthern EuropeSpainSri LankaSt. Vincent and the GrenadinesSudanSwedenSwitzerlandSyriaTaiwanThailandTrinidad and TobagoTurkeyUgandaUkraineUruguayUzbekistanVenezuelaVietnamWest IndiesWestern AfricaWestern AsiaWestern EuropeYemenZaireZimbabweAzores
Immigrants from Bahamas
Race
Ancestry
AfghanAfricanAlaska NativeAlaskan AthabascanAlbanianAleutAlsatianAmericanApacheArabArapahoArgentineanArmenianAssyrian/Chaldean/SyriacAustralianAustrianBahamianBangladeshiBarbadianBasqueBelgianBelizeanBermudanBhutaneseBlackfeetBolivianBrazilianBritishBritish West IndianBulgarianCajunCambodianCanadianCape VerdeanCarpatho RusynCelticCentral AmericanCentral American IndianCherokeeCheyenneChickasawChileanChineseChippewaChoctawColombianColvilleComancheCosta RicanCreeCreekCroatianCrowCubanCypriotCzechCzechoslovakianDanishDelawareDominicanDutchDutch West IndianEastern EuropeanEcuadorianEgyptianEnglishEstonianEthiopianEuropeanFijianFilipinoFinnishFrenchFrench American IndianFrench CanadianGermanGerman RussianGhanaianGreekGuamanian/ChamorroGuatemalanGuyaneseHaitianHmongHonduranHopiHoumaHungarianIcelanderIndian (Asian)IndonesianInupiatIranianIraqiIrishIroquoisIsraeliItalianJamaicanJapaneseJordanianKenyanKiowaKoreanLaotianLatvianLebaneseLiberianLithuanianLumbeeLuxembourgerMacedonianMalaysianMalteseMarshalleseMenomineeMexicanMexican American IndianMongolianMoroccanNative HawaiianNavajoNepaleseNew ZealanderNicaraguanNigerianNorthern EuropeanNorwegianOkinawanOsageOttawaPaiutePakistaniPalestinianPanamanianParaguayanPennsylvania GermanPeruvianPimaPolishPortuguesePotawatomiPuebloPuerto RicanPuget Sound SalishRomanianRussianSalvadoranSamoanScandinavianScotch-IrishScottishSeminoleSenegaleseSerbianShoshoneSierra LeoneanSiouxSlavicSlovakSloveneSomaliSouth AfricanSouth AmericanSouth American IndianSoviet UnionSpaniardSpanishSpanish AmericanSpanish American IndianSri LankanSubsaharan AfricanSudaneseSwedishSwissSyrianTaiwaneseThaiTlingit-HaidaTohono O'OdhamTonganTrinidadian and TobagonianTsimshianTurkishU.S. Virgin IslanderUgandanUkrainianUruguayanUteVenezuelanVietnameseWelshWest IndianYakamaYaquiYugoslavianYumanYup'ikZimbabwean
Immigration
NonimmigrantsImmigrantsAfghanistanAfricaAlbaniaArgentinaArmeniaAsiaAustraliaAustriaBahamasBangladeshBarbadosBelarusBelgiumBelizeBoliviaBosnia and HerzegovinaBrazilBulgariaBurma/MyanmarCabo VerdeCambodiaCameroonCanadaCaribbeanCentral AmericaChileChinaColombiaCongoCosta RicaCroatiaCubaCzechoslovakiaDenmarkDominicaDominican RepublicEastern AfricaEastern AsiaEastern EuropeEcuadorEgyptEl SalvadorEnglandEritreaEthiopiaEuropeFijiFranceGermanyGhanaGreeceGrenadaGuatemalaGuyanaHaitiHondurasHong KongHungaryIndiaIndonesiaIranIraqIrelandIsraelItalyJamaicaJapanJordanKazakhstanKenyaKoreaKuwaitLaosLatin AmericaLatviaLebanonLiberiaLithuaniaMalaysiaMexicoMicronesiaMiddle AfricaMoldovaMoroccoNepalNetherlandsNicaraguaNigeriaNorth AmericaNorth MacedoniaNorthern AfricaNorthern EuropeNorwayOceaniaPakistanPanamaPeruPhilippinesPolandPortugalRomaniaRussiaSaudi ArabiaScotlandSenegalSerbiaSierra LeoneSingaporeSomaliaSouth AfricaSouth AmericaSouth Central AsiaSouth Eastern AsiaSouthern EuropeSpainSri LankaSt. Vincent and the GrenadinesSudanSwedenSwitzerlandSyriaTaiwanThailandTrinidad and TobagoTurkeyUgandaUkraineUruguayUzbekistanVenezuelaVietnamWest IndiesWestern AfricaWestern AsiaWestern EuropeYemenZaireZimbabweAzores
GED/Equivalency
Income
Poverty
Unemployment
Labor Participation
Family Structure
Vehicle Availability
Education Level
Disability

GED/Equivalency Comparison

Burmese

Immigrants from Bahamas

Exceptional
Tragic
88.3%
GED/EQUIVALENCY
99.7/ 100
METRIC RATING
38th/ 347
METRIC RANK
84.2%
GED/EQUIVALENCY
2.6/ 100
METRIC RATING
239th/ 347
METRIC RANK

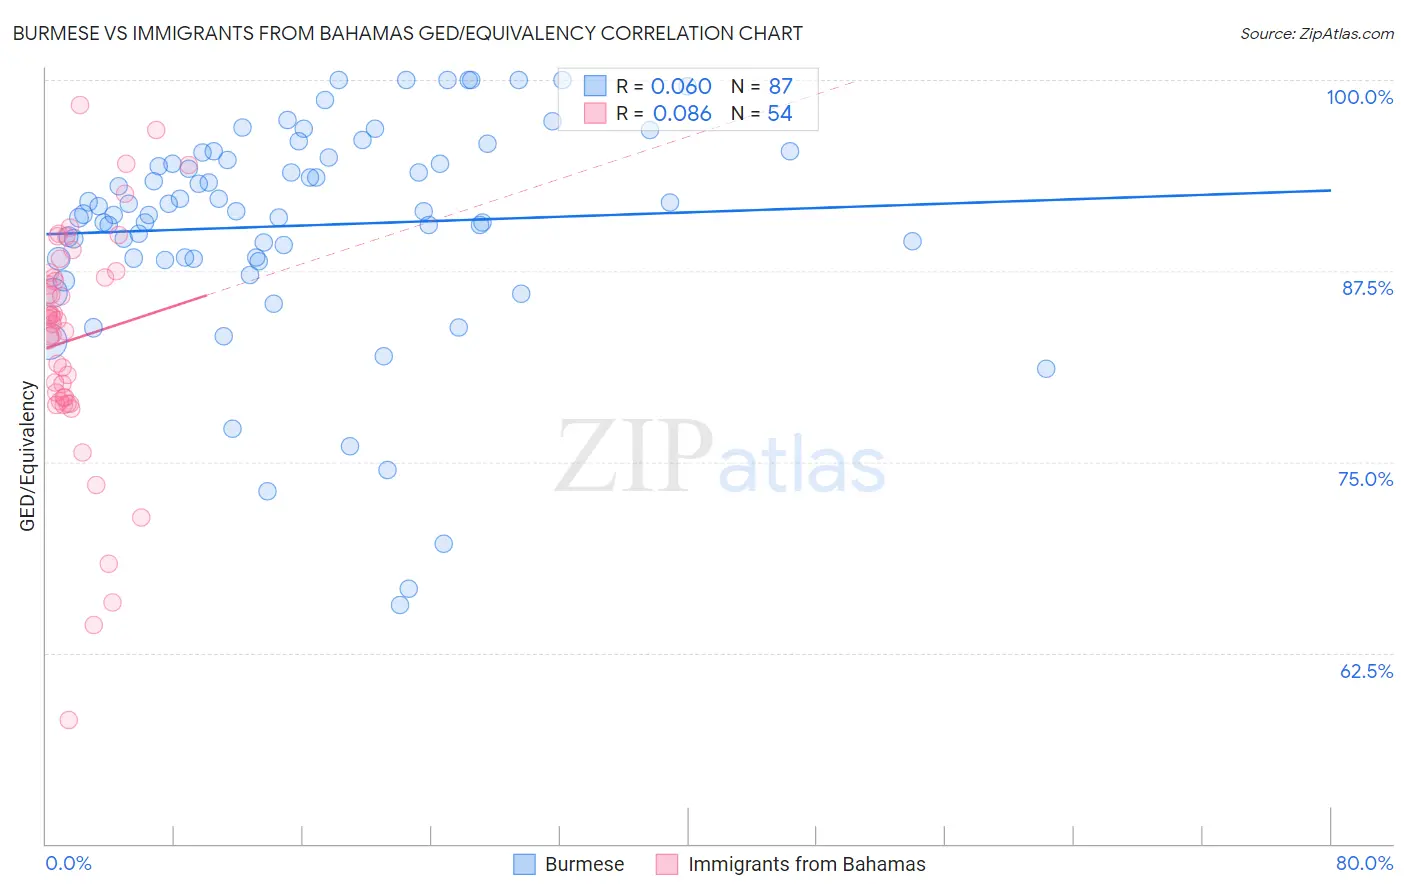
Burmese vs Immigrants from Bahamas GED/Equivalency Correlation Chart

The statistical analysis conducted on geographies consisting of 465,408,087 people shows a slight positive correlation between the proportion of Burmese and percentage of population with at least ged/equivalency education in the United States with a correlation coefficient (R) of 0.060 and weighted average of 88.3%. Similarly, the statistical analysis conducted on geographies consisting of 104,666,801 people shows a slight positive correlation between the proportion of Immigrants from Bahamas and percentage of population with at least ged/equivalency education in the United States with a correlation coefficient (R) of 0.086 and weighted average of 84.2%, a difference of 4.9%.
Burmese vs Immigrants from Bahamas GED/Equivalency

GED/Equivalency Correlation Summary

MeasurementBurmeseImmigrants from Bahamas
Minimum65.6%58.1%
Maximum100.0%98.3%
Range34.4%40.3%
Mean90.5%83.0%
Median91.4%84.3%
Interquartile 25% (IQ1)88.3%79.2%
Interquartile 75% (IQ3)94.9%87.4%
Interquartile Range (IQR)6.6%8.2%
Standard Deviation (Sample)7.2%7.7%
Standard Deviation (Population)7.1%7.7%

Similar Demographics by GED/Equivalency

Demographics Similar to Burmese by GED/Equivalency

In terms of ged/equivalency, the demographic groups most similar to Burmese are Immigrants from Austria (88.3%, a difference of 0.030%), Immigrants from Belgium (88.3%, a difference of 0.060%), Immigrants from South Central Asia (88.4%, a difference of 0.080%), Immigrants from Israel (88.2%, a difference of 0.090%), and Immigrants from Sweden (88.4%, a difference of 0.10%).
DemographicsRating | RankGED/Equivalency
Bhutanese
99.8
/100
|
#31
Exceptional
88.4%
Danes
99.8
/100
|
#32
Exceptional
88.4%
Immigrants | Sweden
99.7
/100
|
#33
Exceptional
88.4%
Immigrants | Japan
99.7
/100
|
#34
Exceptional
88.4%
Immigrants | South Central Asia
99.7
/100
|
#35
Exceptional
88.4%
Immigrants | Belgium
99.7
/100
|
#36
Exceptional
88.3%
Immigrants | Austria
99.7
/100
|
#37
Exceptional
88.3%
Burmese
99.7
/100
|
#38
Exceptional
88.3%
Immigrants | Israel
99.6
/100
|
#39
Exceptional
88.2%
Italians
99.6
/100
|
#40
Exceptional
88.2%
Finns
99.6
/100
|
#41
Exceptional
88.2%
Cambodians
99.6
/100
|
#42
Exceptional
88.2%
Immigrants | Scotland
99.6
/100
|
#43
Exceptional
88.2%
Macedonians
99.5
/100
|
#44
Exceptional
88.1%
Czechs
99.5
/100
|
#45
Exceptional
88.1%

Demographics Similar to Immigrants from Bahamas by GED/Equivalency

In terms of ged/equivalency, the demographic groups most similar to Immigrants from Bahamas are Immigrants from South Eastern Asia (84.1%, a difference of 0.020%), Immigrants from Peru (84.2%, a difference of 0.030%), Subsaharan African (84.2%, a difference of 0.090%), Senegalese (84.0%, a difference of 0.15%), and Ghanaian (84.3%, a difference of 0.16%).
DemographicsRating | RankGED/Equivalency
Immigrants | South America
4.2
/100
|
#232
Tragic
84.4%
Immigrants | Panama
4.1
/100
|
#233
Tragic
84.4%
Immigrants | Nigeria
3.6
/100
|
#234
Tragic
84.3%
Ghanaians
3.5
/100
|
#235
Tragic
84.3%
Immigrants | Eritrea
3.5
/100
|
#236
Tragic
84.3%
Sub-Saharan Africans
3.0
/100
|
#237
Tragic
84.2%
Immigrants | Peru
2.7
/100
|
#238
Tragic
84.2%
Immigrants | Bahamas
2.6
/100
|
#239
Tragic
84.2%
Immigrants | South Eastern Asia
2.5
/100
|
#240
Tragic
84.1%
Senegalese
1.9
/100
|
#241
Tragic
84.0%
Sri Lankans
1.9
/100
|
#242
Tragic
84.0%
Cherokee
1.3
/100
|
#243
Tragic
83.9%
Immigrants | Ghana
1.3
/100
|
#244
Tragic
83.9%
Immigrants | Senegal
1.2
/100
|
#245
Tragic
83.8%
Chickasaw
1.2
/100
|
#246
Tragic
83.8%