Black/African American vs South African College, Under 1 year
COMPARE
Black/African American
South African
College, Under 1 year
College, Under 1 year Comparison
Blacks/African Americans
South Africans
59.4%
COLLEGE, UNDER 1 YEAR
0.0/ 100
METRIC RATING
288th/ 347
METRIC RANK
69.7%
COLLEGE, UNDER 1 YEAR
99.7/ 100
METRIC RATING
53rd/ 347
METRIC RANK
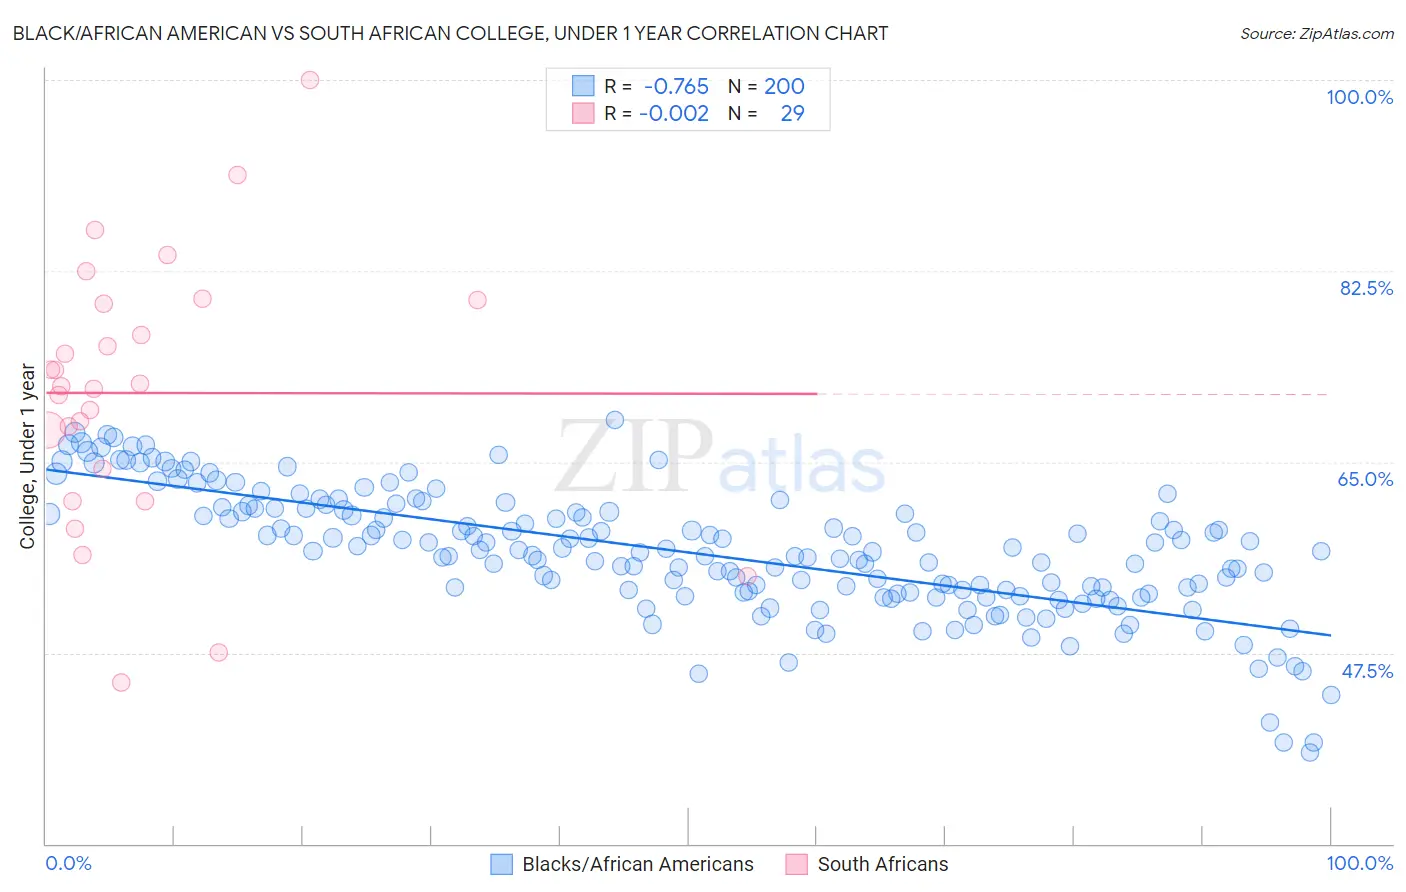
Black/African American vs South African College, Under 1 year Correlation Chart
The statistical analysis conducted on geographies consisting of 566,038,640 people shows a strong negative correlation between the proportion of Blacks/African Americans and percentage of population with at least college, under 1 year education in the United States with a correlation coefficient (R) of -0.765 and weighted average of 59.4%. Similarly, the statistical analysis conducted on geographies consisting of 182,603,987 people shows no correlation between the proportion of South Africans and percentage of population with at least college, under 1 year education in the United States with a correlation coefficient (R) of -0.002 and weighted average of 69.7%, a difference of 17.3%.
College, Under 1 year Correlation Summary
| Measurement | Black/African American | South African |
| Minimum | 38.4% | 44.7% |
| Maximum | 68.9% | 100.0% |
| Range | 30.5% | 55.3% |
| Mean | 56.7% | 71.3% |
| Median | 56.8% | 71.9% |
| Interquartile 25% (IQ1) | 53.0% | 62.9% |
| Interquartile 75% (IQ3) | 60.7% | 79.7% |
| Interquartile Range (IQR) | 7.6% | 16.7% |
| Standard Deviation (Sample) | 5.8% | 12.3% |
| Standard Deviation (Population) | 5.7% | 12.1% |
Similar Demographics by College, Under 1 year
Demographics Similar to Blacks/African Americans by College, Under 1 year
In terms of college, under 1 year, the demographic groups most similar to Blacks/African Americans are Choctaw (59.3%, a difference of 0.070%), Sioux (59.4%, a difference of 0.10%), Ecuadorian (59.3%, a difference of 0.11%), Creek (59.3%, a difference of 0.20%), and Nicaraguan (59.2%, a difference of 0.24%).
| Demographics | Rating | Rank | College, Under 1 year |
| Cherokee | 0.1 /100 | #281 | Tragic 60.1% |
| Belizeans | 0.1 /100 | #282 | Tragic 60.1% |
| Immigrants | Jamaica | 0.0 /100 | #283 | Tragic 59.7% |
| Immigrants | St. Vincent and the Grenadines | 0.0 /100 | #284 | Tragic 59.6% |
| Paiute | 0.0 /100 | #285 | Tragic 59.6% |
| British West Indians | 0.0 /100 | #286 | Tragic 59.5% |
| Sioux | 0.0 /100 | #287 | Tragic 59.4% |
| Blacks/African Americans | 0.0 /100 | #288 | Tragic 59.4% |
| Choctaw | 0.0 /100 | #289 | Tragic 59.3% |
| Ecuadorians | 0.0 /100 | #290 | Tragic 59.3% |
| Creek | 0.0 /100 | #291 | Tragic 59.3% |
| Nicaraguans | 0.0 /100 | #292 | Tragic 59.2% |
| Seminole | 0.0 /100 | #293 | Tragic 59.1% |
| Immigrants | Belize | 0.0 /100 | #294 | Tragic 59.1% |
| Immigrants | Grenada | 0.0 /100 | #295 | Tragic 59.1% |
Demographics Similar to South Africans by College, Under 1 year
In terms of college, under 1 year, the demographic groups most similar to South Africans are Immigrants from Czechoslovakia (69.6%, a difference of 0.12%), Maltese (69.5%, a difference of 0.22%), Immigrants from Russia (69.9%, a difference of 0.27%), Mongolian (69.9%, a difference of 0.30%), and Zimbabwean (69.9%, a difference of 0.33%).
| Demographics | Rating | Rank | College, Under 1 year |
| Immigrants | Latvia | 99.9 /100 | #46 | Exceptional 70.1% |
| Immigrants | Bulgaria | 99.8 /100 | #47 | Exceptional 70.0% |
| Immigrants | Netherlands | 99.8 /100 | #48 | Exceptional 70.0% |
| Immigrants | Austria | 99.8 /100 | #49 | Exceptional 70.0% |
| Zimbabweans | 99.8 /100 | #50 | Exceptional 69.9% |
| Mongolians | 99.8 /100 | #51 | Exceptional 69.9% |
| Immigrants | Russia | 99.8 /100 | #52 | Exceptional 69.9% |
| South Africans | 99.7 /100 | #53 | Exceptional 69.7% |
| Immigrants | Czechoslovakia | 99.7 /100 | #54 | Exceptional 69.6% |
| Maltese | 99.7 /100 | #55 | Exceptional 69.5% |
| Immigrants | Scotland | 99.6 /100 | #56 | Exceptional 69.4% |
| Asians | 99.6 /100 | #57 | Exceptional 69.4% |
| Immigrants | Malaysia | 99.6 /100 | #58 | Exceptional 69.3% |
| Immigrants | Serbia | 99.5 /100 | #59 | Exceptional 69.3% |
| Immigrants | Asia | 99.5 /100 | #60 | Exceptional 69.2% |