Senegalese vs Immigrants from Egypt Female Disability

COMPARE

Senegalese
Race
Ancestry
AfghanAfricanAlaska NativeAlaskan AthabascanAlbanianAleutAlsatianAmericanApacheArabArapahoArgentineanArmenianAssyrian/Chaldean/SyriacAustralianAustrianBahamianBangladeshiBarbadianBasqueBelgianBelizeanBermudanBhutaneseBlackfeetBolivianBrazilianBritishBritish West IndianBulgarianBurmeseCajunCambodianCanadianCape VerdeanCarpatho RusynCelticCentral AmericanCentral American IndianCherokeeCheyenneChickasawChileanChineseChippewaChoctawColombianColvilleComancheCosta RicanCreeCreekCroatianCrowCubanCypriotCzechCzechoslovakianDanishDelawareDominicanDutchDutch West IndianEastern EuropeanEcuadorianEgyptianEnglishEstonianEthiopianEuropeanFijianFilipinoFinnishFrenchFrench American IndianFrench CanadianGermanGerman RussianGhanaianGreekGuamanian/ChamorroGuatemalanGuyaneseHaitianHmongHonduranHopiHoumaHungarianIcelanderIndian (Asian)IndonesianInupiatIranianIraqiIrishIroquoisIsraeliItalianJamaicanJapaneseJordanianKenyanKiowaKoreanLaotianLatvianLebaneseLiberianLithuanianLumbeeLuxembourgerMacedonianMalaysianMalteseMarshalleseMenomineeMexicanMexican American IndianMongolianMoroccanNative HawaiianNavajoNepaleseNew ZealanderNicaraguanNigerianNorthern EuropeanNorwegianOkinawanOsageOttawaPaiutePakistaniPalestinianPanamanianParaguayanPennsylvania GermanPeruvianPimaPolishPortuguesePotawatomiPuebloPuerto RicanPuget Sound SalishRomanianRussianSalvadoranSamoanScandinavianScotch-IrishScottishSeminoleSenegaleseSerbianShoshoneSierra LeoneanSiouxSlavicSlovakSloveneSomaliSouth AfricanSouth AmericanSouth American IndianSoviet UnionSpaniardSpanishSpanish AmericanSpanish American IndianSri LankanSubsaharan AfricanSudaneseSwedishSwissSyrianTaiwaneseThaiTlingit-HaidaTohono O'OdhamTonganTrinidadian and TobagonianTsimshianTurkishU.S. Virgin IslanderUgandanUkrainianUruguayanUteVenezuelanVietnameseWelshWest IndianYakamaYaquiYugoslavianYumanYup'ikZimbabwean
Immigration
NonimmigrantsImmigrantsAfghanistanAfricaAlbaniaArgentinaArmeniaAsiaAustraliaAustriaBahamasBangladeshBarbadosBelarusBelgiumBelizeBoliviaBosnia and HerzegovinaBrazilBulgariaBurma/MyanmarCabo VerdeCambodiaCameroonCanadaCaribbeanCentral AmericaChileChinaColombiaCongoCosta RicaCroatiaCubaCzechoslovakiaDenmarkDominicaDominican RepublicEastern AfricaEastern AsiaEastern EuropeEcuadorEl SalvadorEnglandEritreaEthiopiaEuropeFijiFranceGermanyGhanaGreeceGrenadaGuatemalaGuyanaHaitiHondurasHong KongHungaryIndiaIndonesiaIranIraqIrelandIsraelItalyJamaicaJapanJordanKazakhstanKenyaKoreaKuwaitLaosLatin AmericaLatviaLebanonLiberiaLithuaniaMalaysiaMexicoMicronesiaMiddle AfricaMoldovaMoroccoNepalNetherlandsNicaraguaNigeriaNorth AmericaNorth MacedoniaNorthern AfricaNorthern EuropeNorwayOceaniaPakistanPanamaPeruPhilippinesPolandPortugalRomaniaRussiaSaudi ArabiaScotlandSenegalSerbiaSierra LeoneSingaporeSomaliaSouth AfricaSouth AmericaSouth Central AsiaSouth Eastern AsiaSouthern EuropeSpainSri LankaSt. Vincent and the GrenadinesSudanSwedenSwitzerlandSyriaTaiwanThailandTrinidad and TobagoTurkeyUgandaUkraineUruguayUzbekistanVenezuelaVietnamWest IndiesWestern AfricaWestern AsiaWestern EuropeYemenZaireZimbabweAzores
Immigrants from Egypt
Race
Ancestry
AfghanAfricanAlaska NativeAlaskan AthabascanAlbanianAleutAlsatianAmericanApacheArabArapahoArgentineanArmenianAssyrian/Chaldean/SyriacAustralianAustrianBahamianBangladeshiBarbadianBasqueBelgianBelizeanBermudanBhutaneseBlackfeetBolivianBrazilianBritishBritish West IndianBulgarianBurmeseCajunCambodianCanadianCape VerdeanCarpatho RusynCelticCentral AmericanCentral American IndianCherokeeCheyenneChickasawChileanChineseChippewaChoctawColombianColvilleComancheCosta RicanCreeCreekCroatianCrowCubanCypriotCzechCzechoslovakianDanishDelawareDominicanDutchDutch West IndianEastern EuropeanEcuadorianEgyptianEnglishEstonianEthiopianEuropeanFijianFilipinoFinnishFrenchFrench American IndianFrench CanadianGermanGerman RussianGhanaianGreekGuamanian/ChamorroGuatemalanGuyaneseHaitianHmongHonduranHopiHoumaHungarianIcelanderIndian (Asian)IndonesianInupiatIranianIraqiIrishIroquoisIsraeliItalianJamaicanJapaneseJordanianKenyanKiowaKoreanLaotianLatvianLebaneseLiberianLithuanianLumbeeLuxembourgerMacedonianMalaysianMalteseMarshalleseMenomineeMexicanMexican American IndianMongolianMoroccanNative HawaiianNavajoNepaleseNew ZealanderNicaraguanNigerianNorthern EuropeanNorwegianOkinawanOsageOttawaPaiutePakistaniPalestinianPanamanianParaguayanPennsylvania GermanPeruvianPimaPolishPortuguesePotawatomiPuebloPuerto RicanPuget Sound SalishRomanianRussianSalvadoranSamoanScandinavianScotch-IrishScottishSeminoleSerbianShoshoneSierra LeoneanSiouxSlavicSlovakSloveneSomaliSouth AfricanSouth AmericanSouth American IndianSoviet UnionSpaniardSpanishSpanish AmericanSpanish American IndianSri LankanSubsaharan AfricanSudaneseSwedishSwissSyrianTaiwaneseThaiTlingit-HaidaTohono O'OdhamTonganTrinidadian and TobagonianTsimshianTurkishU.S. Virgin IslanderUgandanUkrainianUruguayanUteVenezuelanVietnameseWelshWest IndianYakamaYaquiYugoslavianYumanYup'ikZimbabwean
Immigration
NonimmigrantsImmigrantsAfghanistanAfricaAlbaniaArgentinaArmeniaAsiaAustraliaAustriaBahamasBangladeshBarbadosBelarusBelgiumBelizeBoliviaBosnia and HerzegovinaBrazilBulgariaBurma/MyanmarCabo VerdeCambodiaCameroonCanadaCaribbeanCentral AmericaChileChinaColombiaCongoCosta RicaCroatiaCubaCzechoslovakiaDenmarkDominicaDominican RepublicEastern AfricaEastern AsiaEastern EuropeEcuadorEgyptEl SalvadorEnglandEritreaEthiopiaEuropeFijiFranceGermanyGhanaGreeceGrenadaGuatemalaGuyanaHaitiHondurasHong KongHungaryIndiaIndonesiaIranIraqIrelandIsraelItalyJamaicaJapanJordanKazakhstanKenyaKoreaKuwaitLaosLatin AmericaLatviaLebanonLiberiaLithuaniaMalaysiaMexicoMicronesiaMiddle AfricaMoldovaMoroccoNepalNetherlandsNicaraguaNigeriaNorth AmericaNorth MacedoniaNorthern AfricaNorthern EuropeNorwayOceaniaPakistanPanamaPeruPhilippinesPolandPortugalRomaniaRussiaSaudi ArabiaScotlandSenegalSerbiaSierra LeoneSingaporeSomaliaSouth AfricaSouth AmericaSouth Central AsiaSouth Eastern AsiaSouthern EuropeSpainSri LankaSt. Vincent and the GrenadinesSudanSwedenSwitzerlandSyriaTaiwanThailandTrinidad and TobagoTurkeyUgandaUkraineUruguayUzbekistanVenezuelaVietnamWest IndiesWestern AfricaWestern AsiaWestern EuropeYemenZaireZimbabweAzores
Female Disability
Income
Poverty
Unemployment
Labor Participation
Family Structure
Vehicle Availability
Education Level
Disability

Female Disability Comparison

Senegalese

Immigrants from Egypt

Tragic
Exceptional
12.8%
FEMALE DISABILITY
0.4/ 100
METRIC RATING
267th/ 347
METRIC RANK
11.1%
FEMALE DISABILITY
100.0/ 100
METRIC RATING
33rd/ 347
METRIC RANK

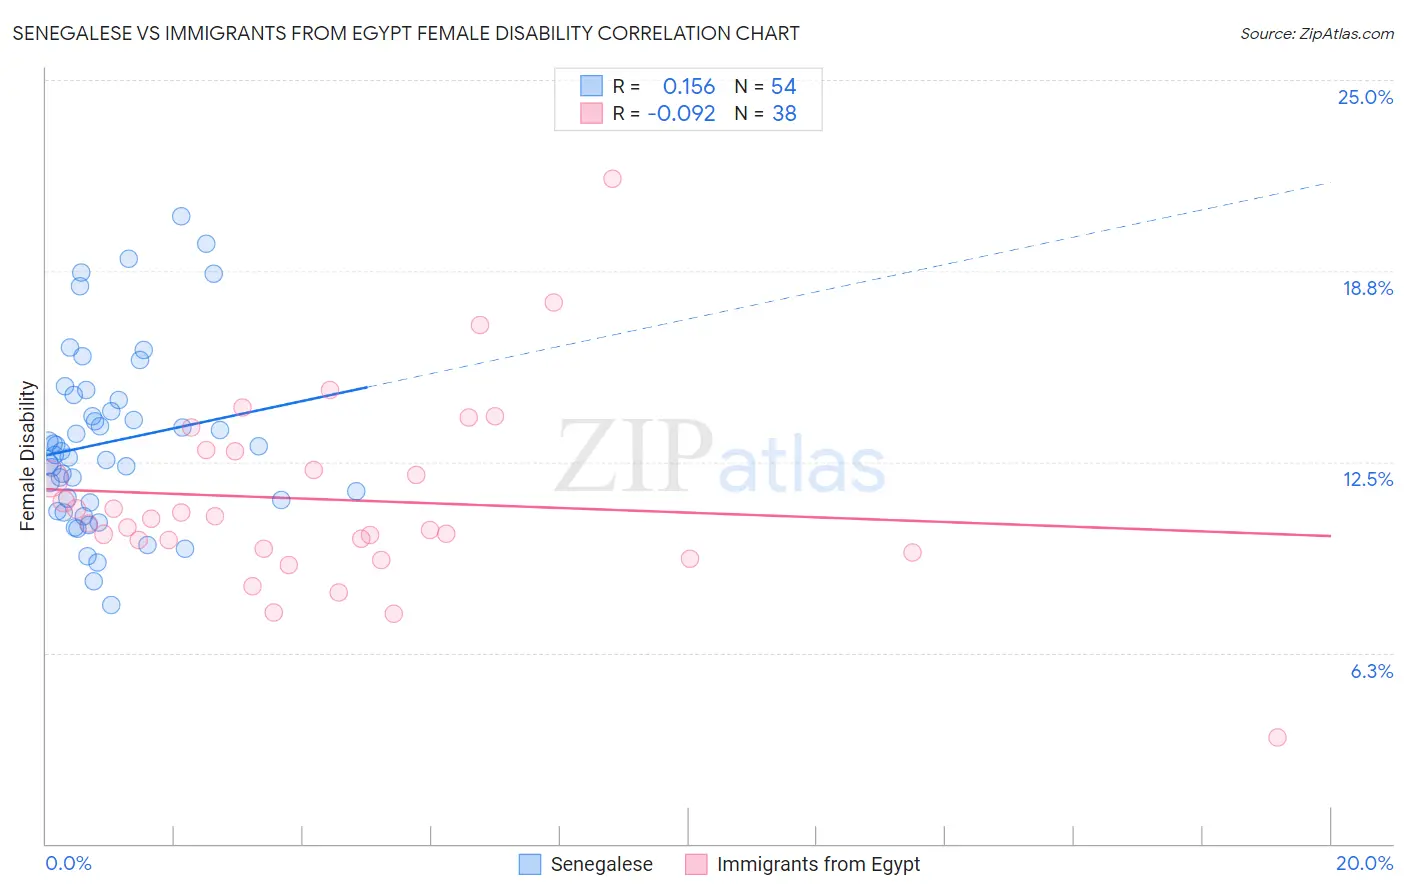
Senegalese vs Immigrants from Egypt Female Disability Correlation Chart

The statistical analysis conducted on geographies consisting of 78,142,569 people shows a poor positive correlation between the proportion of Senegalese and percentage of females with a disability in the United States with a correlation coefficient (R) of 0.156 and weighted average of 12.8%. Similarly, the statistical analysis conducted on geographies consisting of 245,491,192 people shows a slight negative correlation between the proportion of Immigrants from Egypt and percentage of females with a disability in the United States with a correlation coefficient (R) of -0.092 and weighted average of 11.1%, a difference of 15.1%.
Senegalese vs Immigrants from Egypt Female Disability

Female Disability Correlation Summary

MeasurementSenegaleseImmigrants from Egypt
Minimum7.8%3.5%
Maximum20.6%21.8%
Range12.7%18.3%
Mean13.2%11.3%
Median12.8%10.6%
Interquartile 25% (IQ1)11.2%9.7%
Interquartile 75% (IQ3)14.5%12.8%
Interquartile Range (IQR)3.4%3.2%
Standard Deviation (Sample)2.9%3.2%
Standard Deviation (Population)2.9%3.1%

Similar Demographics by Female Disability

Demographics Similar to Senegalese by Female Disability

In terms of female disability, the demographic groups most similar to Senegalese are Finnish (12.8%, a difference of 0.020%), Immigrants from Laos (12.8%, a difference of 0.030%), Indonesian (12.8%, a difference of 0.090%), West Indian (12.8%, a difference of 0.13%), and Immigrants from Liberia (12.9%, a difference of 0.27%).
DemographicsRating | RankFemale Disability
Sub-Saharan Africans
1.0
/100
|
#260
Tragic
12.7%
Bermudans
1.0
/100
|
#261
Tragic
12.7%
Czechoslovakians
0.9
/100
|
#262
Tragic
12.7%
Spaniards
0.7
/100
|
#263
Tragic
12.8%
Alaska Natives
0.6
/100
|
#264
Tragic
12.8%
West Indians
0.5
/100
|
#265
Tragic
12.8%
Finns
0.4
/100
|
#266
Tragic
12.8%
Senegalese
0.4
/100
|
#267
Tragic
12.8%
Immigrants | Laos
0.4
/100
|
#268
Tragic
12.8%
Indonesians
0.4
/100
|
#269
Tragic
12.8%
Immigrants | Liberia
0.3
/100
|
#270
Tragic
12.9%
Dutch
0.2
/100
|
#271
Tragic
12.9%
Germans
0.1
/100
|
#272
Tragic
12.9%
Sioux
0.1
/100
|
#273
Tragic
12.9%
Portuguese
0.1
/100
|
#274
Tragic
13.0%

Demographics Similar to Immigrants from Egypt by Female Disability

In terms of female disability, the demographic groups most similar to Immigrants from Egypt are Immigrants from Australia (11.1%, a difference of 0.080%), Immigrants from Kuwait (11.1%, a difference of 0.25%), Immigrants from Indonesia (11.2%, a difference of 0.25%), Immigrants from Malaysia (11.1%, a difference of 0.35%), and Turkish (11.1%, a difference of 0.35%).
DemographicsRating | RankFemale Disability
Argentineans
100.0
/100
|
#26
Exceptional
11.0%
Immigrants | Turkey
100.0
/100
|
#27
Exceptional
11.1%
Egyptians
100.0
/100
|
#28
Exceptional
11.1%
Immigrants | Malaysia
100.0
/100
|
#29
Exceptional
11.1%
Turks
100.0
/100
|
#30
Exceptional
11.1%
Immigrants | Kuwait
100.0
/100
|
#31
Exceptional
11.1%
Immigrants | Australia
100.0
/100
|
#32
Exceptional
11.1%
Immigrants | Egypt
100.0
/100
|
#33
Exceptional
11.1%
Immigrants | Indonesia
100.0
/100
|
#34
Exceptional
11.2%
Immigrants | Japan
100.0
/100
|
#35
Exceptional
11.2%
Cypriots
100.0
/100
|
#36
Exceptional
11.2%
Ethiopians
100.0
/100
|
#37
Exceptional
11.2%
Immigrants | Ethiopia
100.0
/100
|
#38
Exceptional
11.2%
Immigrants | Lithuania
100.0
/100
|
#39
Exceptional
11.2%
Mongolians
100.0
/100
|
#40
Exceptional
11.2%