Paiute vs Pennsylvania German Disability
COMPARE
Paiute
Pennsylvania German
Disability
Disability Comparison
Paiute
Pennsylvania Germans
13.9%
DISABILITY
0.0/ 100
METRIC RATING
321st/ 347
METRIC RANK
13.2%
DISABILITY
0.0/ 100
METRIC RATING
300th/ 347
METRIC RANK
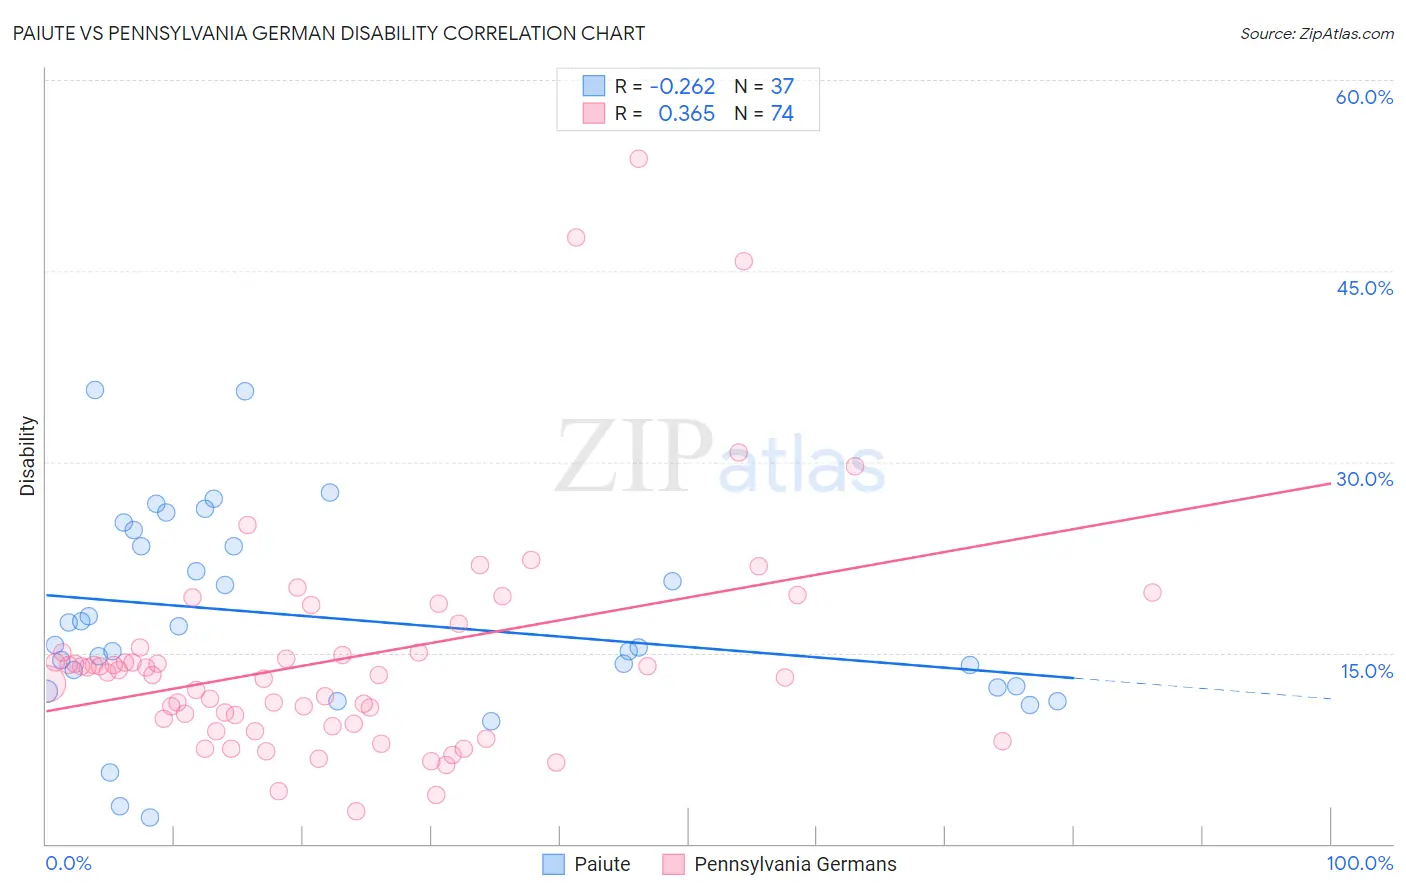
Paiute vs Pennsylvania German Disability Correlation Chart
The statistical analysis conducted on geographies consisting of 58,394,773 people shows a weak negative correlation between the proportion of Paiute and percentage of population with a disability in the United States with a correlation coefficient (R) of -0.262 and weighted average of 13.9%. Similarly, the statistical analysis conducted on geographies consisting of 234,103,630 people shows a mild positive correlation between the proportion of Pennsylvania Germans and percentage of population with a disability in the United States with a correlation coefficient (R) of 0.365 and weighted average of 13.2%, a difference of 5.3%.
Disability Correlation Summary
| Measurement | Paiute | Pennsylvania German |
| Minimum | 2.1% | 2.6% |
| Maximum | 35.7% | 53.8% |
| Range | 33.6% | 51.3% |
| Mean | 17.7% | 14.5% |
| Median | 15.7% | 13.4% |
| Interquartile 25% (IQ1) | 12.3% | 9.5% |
| Interquartile 75% (IQ3) | 24.0% | 15.1% |
| Interquartile Range (IQR) | 11.7% | 5.6% |
| Standard Deviation (Sample) | 7.9% | 9.0% |
| Standard Deviation (Population) | 7.8% | 8.9% |
Similar Demographics by Disability
Demographics Similar to Paiute by Disability
In terms of disability, the demographic groups most similar to Paiute are Apache (13.9%, a difference of 0.13%), Iroquois (13.8%, a difference of 0.42%), American (13.9%, a difference of 0.42%), Menominee (13.8%, a difference of 0.63%), and Pima (13.7%, a difference of 1.2%).
| Demographics | Rating | Rank | Disability |
| Blacks/African Americans | 0.0 /100 | #314 | Tragic 13.7% |
| Puget Sound Salish | 0.0 /100 | #315 | Tragic 13.7% |
| Pima | 0.0 /100 | #316 | Tragic 13.7% |
| Immigrants | Cabo Verde | 0.0 /100 | #317 | Tragic 13.7% |
| Menominee | 0.0 /100 | #318 | Tragic 13.8% |
| Iroquois | 0.0 /100 | #319 | Tragic 13.8% |
| Apache | 0.0 /100 | #320 | Tragic 13.9% |
| Paiute | 0.0 /100 | #321 | Tragic 13.9% |
| Americans | 0.0 /100 | #322 | Tragic 13.9% |
| Comanche | 0.0 /100 | #323 | Tragic 14.1% |
| Chippewa | 0.0 /100 | #324 | Tragic 14.1% |
| Natives/Alaskans | 0.0 /100 | #325 | Tragic 14.2% |
| Osage | 0.0 /100 | #326 | Tragic 14.2% |
| Ottawa | 0.0 /100 | #327 | Tragic 14.2% |
| Immigrants | Azores | 0.0 /100 | #328 | Tragic 14.2% |
Demographics Similar to Pennsylvania Germans by Disability
In terms of disability, the demographic groups most similar to Pennsylvania Germans are French (13.2%, a difference of 0.050%), Hopi (13.2%, a difference of 0.070%), Alaska Native (13.2%, a difference of 0.070%), Immigrants from Micronesia (13.2%, a difference of 0.090%), and Central American Indian (13.2%, a difference of 0.13%).
| Demographics | Rating | Rank | Disability |
| Marshallese | 0.0 /100 | #293 | Tragic 13.1% |
| Celtics | 0.0 /100 | #294 | Tragic 13.1% |
| Immigrants | Nonimmigrants | 0.0 /100 | #295 | Tragic 13.2% |
| Central American Indians | 0.0 /100 | #296 | Tragic 13.2% |
| Hopi | 0.0 /100 | #297 | Tragic 13.2% |
| Alaska Natives | 0.0 /100 | #298 | Tragic 13.2% |
| French | 0.0 /100 | #299 | Tragic 13.2% |
| Pennsylvania Germans | 0.0 /100 | #300 | Tragic 13.2% |
| Immigrants | Micronesia | 0.0 /100 | #301 | Tragic 13.2% |
| Arapaho | 0.0 /100 | #302 | Tragic 13.2% |
| Scotch-Irish | 0.0 /100 | #303 | Tragic 13.3% |
| Yakama | 0.0 /100 | #304 | Tragic 13.4% |
| French Canadians | 0.0 /100 | #305 | Tragic 13.4% |
| Cape Verdeans | 0.0 /100 | #306 | Tragic 13.5% |
| Shoshone | 0.0 /100 | #307 | Tragic 13.5% |