Native/Alaskan vs Immigrants from Western Africa Male Disability

COMPARE

Native/Alaskan
Race
Ancestry
AfghanAfricanAlaska NativeAlaskan AthabascanAlbanianAleutAlsatianAmericanApacheArabArapahoArgentineanArmenianAssyrian/Chaldean/SyriacAustralianAustrianBahamianBangladeshiBarbadianBasqueBelgianBelizeanBermudanBhutaneseBlackfeetBolivianBrazilianBritishBritish West IndianBulgarianBurmeseCajunCambodianCanadianCape VerdeanCarpatho RusynCelticCentral AmericanCentral American IndianCherokeeCheyenneChickasawChileanChineseChippewaChoctawColombianColvilleComancheCosta RicanCreeCreekCroatianCrowCubanCypriotCzechCzechoslovakianDanishDelawareDominicanDutchDutch West IndianEastern EuropeanEcuadorianEgyptianEnglishEstonianEthiopianEuropeanFijianFilipinoFinnishFrenchFrench American IndianFrench CanadianGermanGerman RussianGhanaianGreekGuamanian/ChamorroGuatemalanGuyaneseHaitianHmongHonduranHopiHoumaHungarianIcelanderIndian (Asian)IndonesianInupiatIranianIraqiIrishIroquoisIsraeliItalianJamaicanJapaneseJordanianKenyanKiowaKoreanLaotianLatvianLebaneseLiberianLithuanianLumbeeLuxembourgerMacedonianMalaysianMalteseMarshalleseMenomineeMexicanMexican American IndianMongolianMoroccanNative HawaiianNavajoNepaleseNew ZealanderNicaraguanNigerianNorthern EuropeanNorwegianOkinawanOsageOttawaPaiutePakistaniPalestinianPanamanianParaguayanPennsylvania GermanPeruvianPimaPolishPortuguesePotawatomiPuebloPuerto RicanPuget Sound SalishRomanianRussianSalvadoranSamoanScandinavianScotch-IrishScottishSeminoleSenegaleseSerbianShoshoneSierra LeoneanSiouxSlavicSlovakSloveneSomaliSouth AfricanSouth AmericanSouth American IndianSoviet UnionSpaniardSpanishSpanish AmericanSpanish American IndianSri LankanSubsaharan AfricanSudaneseSwedishSwissSyrianTaiwaneseThaiTlingit-HaidaTohono O'OdhamTonganTrinidadian and TobagonianTsimshianTurkishU.S. Virgin IslanderUgandanUkrainianUruguayanUteVenezuelanVietnameseWelshWest IndianYakamaYaquiYugoslavianYumanYup'ikZimbabwean
Immigration
NonimmigrantsImmigrantsAfghanistanAfricaAlbaniaArgentinaArmeniaAsiaAustraliaAustriaBahamasBangladeshBarbadosBelarusBelgiumBelizeBoliviaBosnia and HerzegovinaBrazilBulgariaBurma/MyanmarCabo VerdeCambodiaCameroonCanadaCaribbeanCentral AmericaChileChinaColombiaCongoCosta RicaCroatiaCubaCzechoslovakiaDenmarkDominicaDominican RepublicEastern AfricaEastern AsiaEastern EuropeEcuadorEgyptEl SalvadorEnglandEritreaEthiopiaEuropeFijiFranceGermanyGhanaGreeceGrenadaGuatemalaGuyanaHaitiHondurasHong KongHungaryIndiaIndonesiaIranIraqIrelandIsraelItalyJamaicaJapanJordanKazakhstanKenyaKoreaKuwaitLaosLatin AmericaLatviaLebanonLiberiaLithuaniaMalaysiaMexicoMicronesiaMiddle AfricaMoldovaMoroccoNepalNetherlandsNicaraguaNigeriaNorth AmericaNorth MacedoniaNorthern AfricaNorthern EuropeNorwayOceaniaPakistanPanamaPeruPhilippinesPolandPortugalRomaniaRussiaSaudi ArabiaScotlandSenegalSerbiaSierra LeoneSingaporeSomaliaSouth AfricaSouth AmericaSouth Central AsiaSouth Eastern AsiaSouthern EuropeSpainSri LankaSt. Vincent and the GrenadinesSudanSwedenSwitzerlandSyriaTaiwanThailandTrinidad and TobagoTurkeyUgandaUkraineUruguayUzbekistanVenezuelaVietnamWest IndiesWestern AsiaWestern EuropeYemenZaireZimbabweAzores
Immigrants from Western Africa
Race
Ancestry
AfghanAfricanAlaska NativeAlaskan AthabascanAlbanianAleutAlsatianAmericanApacheArabArapahoArgentineanArmenianAssyrian/Chaldean/SyriacAustralianAustrianBahamianBangladeshiBarbadianBasqueBelgianBelizeanBermudanBhutaneseBlackfeetBolivianBrazilianBritishBritish West IndianBulgarianBurmeseCajunCambodianCanadianCape VerdeanCarpatho RusynCelticCentral AmericanCentral American IndianCherokeeCheyenneChickasawChileanChineseChippewaChoctawColombianColvilleComancheCosta RicanCreeCreekCroatianCrowCubanCypriotCzechCzechoslovakianDanishDelawareDominicanDutchDutch West IndianEastern EuropeanEcuadorianEgyptianEnglishEstonianEthiopianEuropeanFijianFilipinoFinnishFrenchFrench American IndianFrench CanadianGermanGerman RussianGhanaianGreekGuamanian/ChamorroGuatemalanGuyaneseHaitianHmongHonduranHopiHoumaHungarianIcelanderIndian (Asian)IndonesianInupiatIranianIraqiIrishIroquoisIsraeliItalianJamaicanJapaneseJordanianKenyanKiowaKoreanLaotianLatvianLebaneseLiberianLithuanianLumbeeLuxembourgerMacedonianMalaysianMalteseMarshalleseMenomineeMexicanMexican American IndianMongolianMoroccanNative HawaiianNavajoNepaleseNew ZealanderNicaraguanNigerianNorthern EuropeanNorwegianOkinawanOsageOttawaPaiutePakistaniPalestinianPanamanianParaguayanPennsylvania GermanPeruvianPimaPolishPortuguesePotawatomiPuebloPuerto RicanPuget Sound SalishRomanianRussianSalvadoranSamoanScandinavianScotch-IrishScottishSeminoleSenegaleseSerbianShoshoneSierra LeoneanSiouxSlavicSlovakSloveneSomaliSouth AfricanSouth AmericanSouth American IndianSoviet UnionSpaniardSpanishSpanish AmericanSpanish American IndianSri LankanSubsaharan AfricanSudaneseSwedishSwissSyrianTaiwaneseThaiTlingit-HaidaTohono O'OdhamTonganTrinidadian and TobagonianTsimshianTurkishU.S. Virgin IslanderUgandanUkrainianUruguayanUteVenezuelanVietnameseWelshWest IndianYakamaYaquiYugoslavianYumanYup'ikZimbabwean
Immigration
NonimmigrantsImmigrantsAfghanistanAfricaAlbaniaArgentinaArmeniaAsiaAustraliaAustriaBahamasBangladeshBarbadosBelarusBelgiumBelizeBoliviaBosnia and HerzegovinaBrazilBulgariaBurma/MyanmarCabo VerdeCambodiaCameroonCanadaCaribbeanCentral AmericaChileChinaColombiaCongoCosta RicaCroatiaCubaCzechoslovakiaDenmarkDominicaDominican RepublicEastern AfricaEastern AsiaEastern EuropeEcuadorEgyptEl SalvadorEnglandEritreaEthiopiaEuropeFijiFranceGermanyGhanaGreeceGrenadaGuatemalaGuyanaHaitiHondurasHong KongHungaryIndiaIndonesiaIranIraqIrelandIsraelItalyJamaicaJapanJordanKazakhstanKenyaKoreaKuwaitLaosLatin AmericaLatviaLebanonLiberiaLithuaniaMalaysiaMexicoMicronesiaMiddle AfricaMoldovaMoroccoNepalNetherlandsNicaraguaNigeriaNorth AmericaNorth MacedoniaNorthern AfricaNorthern EuropeNorwayOceaniaPakistanPanamaPeruPhilippinesPolandPortugalRomaniaRussiaSaudi ArabiaScotlandSenegalSerbiaSierra LeoneSingaporeSomaliaSouth AfricaSouth AmericaSouth Central AsiaSouth Eastern AsiaSouthern EuropeSpainSri LankaSt. Vincent and the GrenadinesSudanSwedenSwitzerlandSyriaTaiwanThailandTrinidad and TobagoTurkeyUgandaUkraineUruguayUzbekistanVenezuelaVietnamWest IndiesWestern AfricaWestern AsiaWestern EuropeYemenZaireZimbabweAzores
Male Disability
Income
Poverty
Unemployment
Labor Participation
Family Structure
Vehicle Availability
Education Level
Disability

Male Disability Comparison

Natives/Alaskans

Immigrants from Western Africa

Tragic
Good
14.2%
MALE DISABILITY
0.0/ 100
METRIC RATING
326th/ 347
METRIC RANK
11.1%
MALE DISABILITY
69.2/ 100
METRIC RATING
157th/ 347
METRIC RANK

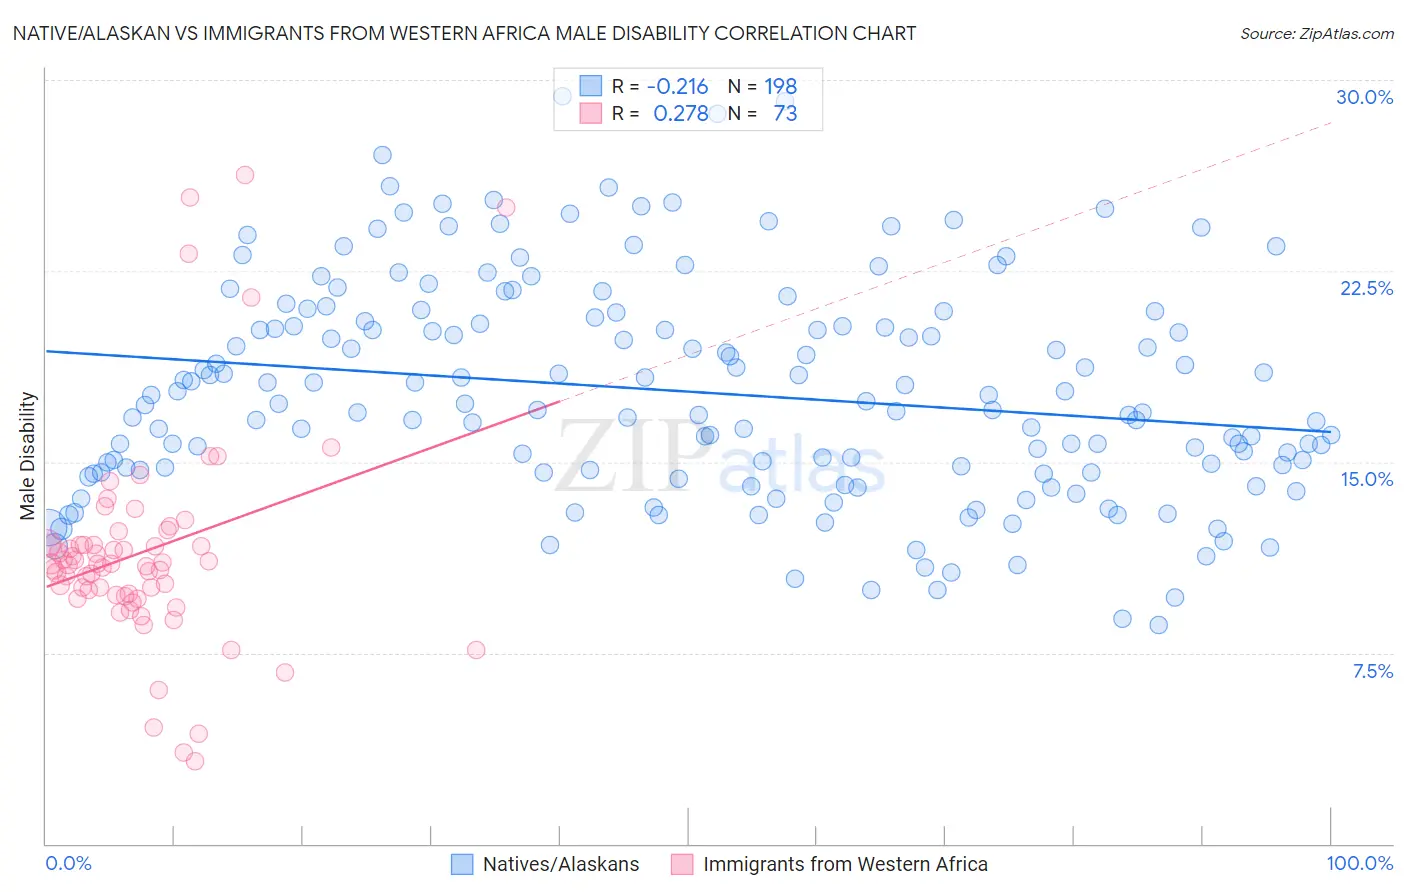
Native/Alaskan vs Immigrants from Western Africa Male Disability Correlation Chart

The statistical analysis conducted on geographies consisting of 512,854,069 people shows a weak negative correlation between the proportion of Natives/Alaskans and percentage of males with a disability in the United States with a correlation coefficient (R) of -0.216 and weighted average of 14.2%. Similarly, the statistical analysis conducted on geographies consisting of 357,781,594 people shows a weak positive correlation between the proportion of Immigrants from Western Africa and percentage of males with a disability in the United States with a correlation coefficient (R) of 0.278 and weighted average of 11.1%, a difference of 28.1%.
Native/Alaskan vs Immigrants from Western Africa Male Disability

Male Disability Correlation Summary

MeasurementNative/AlaskanImmigrants from Western Africa
Minimum8.6%3.3%
Maximum29.4%26.3%
Range20.8%23.0%
Mean17.8%11.5%
Median17.3%11.0%
Interquartile 25% (IQ1)14.7%9.8%
Interquartile 75% (IQ3)20.5%11.8%
Interquartile Range (IQR)5.9%2.0%
Standard Deviation (Sample)4.3%4.2%
Standard Deviation (Population)4.3%4.2%

Similar Demographics by Male Disability

Demographics Similar to Natives/Alaskans by Male Disability

In terms of male disability, the demographic groups most similar to Natives/Alaskans are Potawatomi (14.2%, a difference of 0.10%), Chippewa (14.3%, a difference of 0.53%), Ottawa (14.1%, a difference of 0.94%), Comanche (14.1%, a difference of 1.1%), and Cajun (14.4%, a difference of 1.1%).
DemographicsRating | RankMale Disability
Americans
0.0
/100
|
#319
Tragic
13.8%
Tlingit-Haida
0.0
/100
|
#320
Tragic
13.8%
Shoshone
0.0
/100
|
#321
Tragic
13.8%
Apache
0.0
/100
|
#322
Tragic
14.0%
Osage
0.0
/100
|
#323
Tragic
14.0%
Comanche
0.0
/100
|
#324
Tragic
14.1%
Ottawa
0.0
/100
|
#325
Tragic
14.1%
Natives/Alaskans
0.0
/100
|
#326
Tragic
14.2%
Potawatomi
0.0
/100
|
#327
Tragic
14.2%
Chippewa
0.0
/100
|
#328
Tragic
14.3%
Cajuns
0.0
/100
|
#329
Tragic
14.4%
Navajo
0.0
/100
|
#330
Tragic
14.4%
Tohono O'odham
0.0
/100
|
#331
Tragic
14.6%
Seminole
0.0
/100
|
#332
Tragic
14.7%
Yuman
0.0
/100
|
#333
Tragic
14.7%

Demographics Similar to Immigrants from Western Africa by Male Disability

In terms of male disability, the demographic groups most similar to Immigrants from Western Africa are Russian (11.1%, a difference of 0.040%), Latvian (11.1%, a difference of 0.070%), Immigrants from Middle Africa (11.1%, a difference of 0.11%), Guatemalan (11.1%, a difference of 0.13%), and Albanian (11.1%, a difference of 0.18%).
DemographicsRating | RankMale Disability
Immigrants | Guatemala
75.1
/100
|
#150
Good
11.0%
Cubans
74.9
/100
|
#151
Good
11.0%
Immigrants | Albania
74.4
/100
|
#152
Good
11.0%
Immigrants | Northern Europe
73.2
/100
|
#153
Good
11.1%
Immigrants | Moldova
72.8
/100
|
#154
Good
11.1%
Immigrants | Middle Africa
70.9
/100
|
#155
Good
11.1%
Russians
69.8
/100
|
#156
Good
11.1%
Immigrants | Western Africa
69.2
/100
|
#157
Good
11.1%
Latvians
68.1
/100
|
#158
Good
11.1%
Guatemalans
67.2
/100
|
#159
Good
11.1%
Albanians
66.5
/100
|
#160
Good
11.1%
Immigrants | West Indies
65.7
/100
|
#161
Good
11.1%
Immigrants | Haiti
65.3
/100
|
#162
Good
11.1%
Immigrants | Kenya
63.8
/100
|
#163
Good
11.1%
British West Indians
62.8
/100
|
#164
Good
11.1%