Immigrants from Southern Europe vs Indian (Asian) Disability
COMPARE
Immigrants from Southern Europe
Indian (Asian)
Disability
Disability Comparison
Immigrants from Southern Europe
Indians (Asian)
11.7%
DISABILITY
52.8/ 100
METRIC RATING
171st/ 347
METRIC RANK
10.3%
DISABILITY
100.0/ 100
METRIC RATING
16th/ 347
METRIC RANK
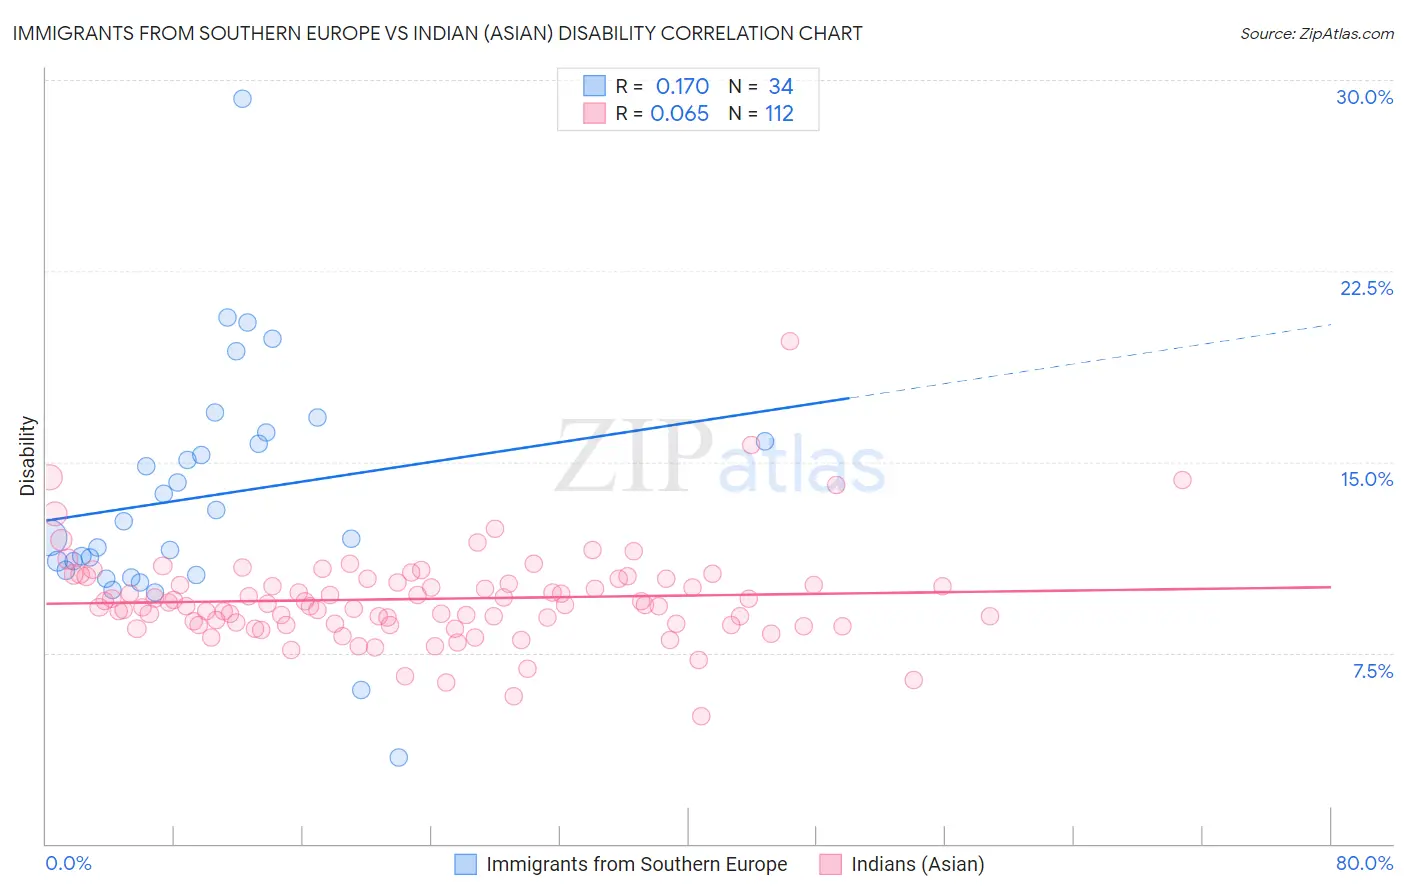
Immigrants from Southern Europe vs Indian (Asian) Disability Correlation Chart
The statistical analysis conducted on geographies consisting of 402,790,716 people shows a poor positive correlation between the proportion of Immigrants from Southern Europe and percentage of population with a disability in the United States with a correlation coefficient (R) of 0.170 and weighted average of 11.7%. Similarly, the statistical analysis conducted on geographies consisting of 495,278,900 people shows a slight positive correlation between the proportion of Indians (Asian) and percentage of population with a disability in the United States with a correlation coefficient (R) of 0.065 and weighted average of 10.3%, a difference of 13.9%.
Disability Correlation Summary
| Measurement | Immigrants from Southern Europe | Indian (Asian) |
| Minimum | 3.4% | 5.0% |
| Maximum | 29.3% | 19.7% |
| Range | 25.9% | 14.7% |
| Mean | 13.6% | 9.6% |
| Median | 12.3% | 9.4% |
| Interquartile 25% (IQ1) | 10.7% | 8.6% |
| Interquartile 75% (IQ3) | 15.8% | 10.3% |
| Interquartile Range (IQR) | 5.0% | 1.7% |
| Standard Deviation (Sample) | 4.7% | 1.9% |
| Standard Deviation (Population) | 4.6% | 1.9% |
Similar Demographics by Disability
Demographics Similar to Immigrants from Southern Europe by Disability
In terms of disability, the demographic groups most similar to Immigrants from Southern Europe are Immigrants from Albania (11.7%, a difference of 0.0%), Trinidadian and Tobagonian (11.7%, a difference of 0.010%), Immigrants from Austria (11.7%, a difference of 0.030%), Immigrants from Latin America (11.7%, a difference of 0.060%), and Estonian (11.7%, a difference of 0.070%).
| Demographics | Rating | Rank | Disability |
| Syrians | 58.5 /100 | #164 | Average 11.7% |
| Cubans | 56.7 /100 | #165 | Average 11.7% |
| Pakistanis | 54.7 /100 | #166 | Average 11.7% |
| Estonians | 54.4 /100 | #167 | Average 11.7% |
| Immigrants | Latin America | 54.1 /100 | #168 | Average 11.7% |
| Immigrants | Austria | 53.4 /100 | #169 | Average 11.7% |
| Immigrants | Albania | 52.8 /100 | #170 | Average 11.7% |
| Immigrants | Southern Europe | 52.8 /100 | #171 | Average 11.7% |
| Trinidadians and Tobagonians | 52.7 /100 | #172 | Average 11.7% |
| Maltese | 50.6 /100 | #173 | Average 11.7% |
| Albanians | 50.0 /100 | #174 | Average 11.7% |
| Haitians | 48.6 /100 | #175 | Average 11.7% |
| Immigrants | Western Africa | 47.5 /100 | #176 | Average 11.7% |
| Immigrants | Central America | 46.6 /100 | #177 | Average 11.7% |
| Greeks | 46.2 /100 | #178 | Average 11.7% |
Demographics Similar to Indians (Asian) by Disability
In terms of disability, the demographic groups most similar to Indians (Asian) are Okinawan (10.3%, a difference of 0.070%), Immigrants from Iran (10.3%, a difference of 0.070%), Immigrants from Korea (10.2%, a difference of 0.37%), Immigrants from Eastern Asia (10.2%, a difference of 0.98%), and Burmese (10.4%, a difference of 1.1%).
| Demographics | Rating | Rank | Disability |
| Immigrants | Hong Kong | 100.0 /100 | #9 | Exceptional 10.0% |
| Immigrants | China | 100.0 /100 | #10 | Exceptional 10.1% |
| Iranians | 100.0 /100 | #11 | Exceptional 10.1% |
| Immigrants | Israel | 100.0 /100 | #12 | Exceptional 10.1% |
| Immigrants | Eastern Asia | 100.0 /100 | #13 | Exceptional 10.2% |
| Immigrants | Korea | 100.0 /100 | #14 | Exceptional 10.2% |
| Okinawans | 100.0 /100 | #15 | Exceptional 10.3% |
| Indians (Asian) | 100.0 /100 | #16 | Exceptional 10.3% |
| Immigrants | Iran | 100.0 /100 | #17 | Exceptional 10.3% |
| Burmese | 100.0 /100 | #18 | Exceptional 10.4% |
| Immigrants | Pakistan | 100.0 /100 | #19 | Exceptional 10.4% |
| Immigrants | Venezuela | 100.0 /100 | #20 | Exceptional 10.4% |
| Asians | 100.0 /100 | #21 | Exceptional 10.4% |
| Immigrants | Sri Lanka | 100.0 /100 | #22 | Exceptional 10.5% |
| Immigrants | Asia | 100.0 /100 | #23 | Exceptional 10.5% |